RBSE Solutions for Class 5 Maths Chapter 9 Data
Rajasthan Board RBSE Solutions for Class 5 Maths Chapter 9 Data Textbook Exercise Questions and Answers.
RBSE Class 5 Maths Solutions Chapter 9 Data
Intext Questions:
Question 1.
On every Monday fruits are served to students in the mid-day meal. This time, teacher wants to know, which fruit the students want to eat. The teacher made a table and asked all the students of class 5 for their choice:
Teacher : Name of the five fruits are written below. Raise your hand for a fruit, you like the most.
One by one all the students of class 5 raised hand for their choice of fruit. Teacher puts (✓) checkmark against fruits according to the choice of students.
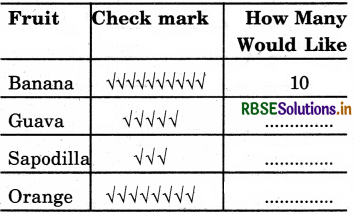
Count ✓ check mark and fill the table.
(1) How many students have given their choice for fruits?
(2) Which fruit is preferred most by students?
(3) Which fruit is preferred least by students?
Solution.
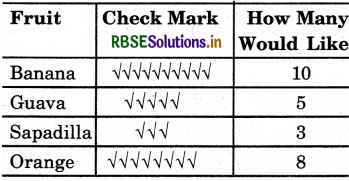
(1) Total number of children = 10 + 5 + 3 + 8 = 26
(2) Banana is preferred by most of the students.
(3) Sapodilla is preffered least by students.

Question 2.
Which fruit is preferred most of the students in your class? To find this, do above activity.
Solution:
We have try tiking of following five fruits in our class and obtained following table :

On the basis of table, we can say that Mango is most preferred.
Question 3.
Neha and Ashu have decided to count number of vehicles crossing from their house between 5 to 6 in the evening. Neha and Ashu have learned about collection of data in their Mathematics class. So they made a table and started counting the vehicles.
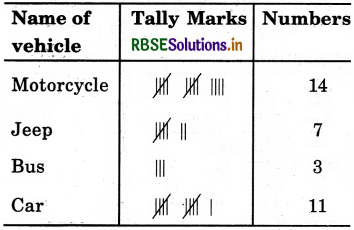
See the above table and find.
(1) How many motorcycles crossed from Neha’s house between 5 to 6 in the evening?
(2) During this time, how many vehicles crossed from Neha’s house?
(3) Which vechicle has crossed the least? Name it.
Solution:
(1) 14,
(2) Total number, of vehicles passed = 14 + 7 + 3 + 11 = 35
(3) Bus is least passed.

Practices Work:
Question 1.
In your class which game is preferred by most of the students ? Find out with the help of table and tally mark.
Solution:
To find about the number of brothers and sisters of students in your class, fill the following table by asking them and answer the given question.
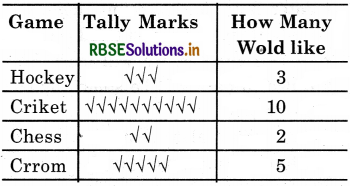
On the basis of table, we can say that Cricket is most liked.
Question 2.
To find about the number of brothers and sisters of students in your class, fill the following table by asking them and answers the given question.
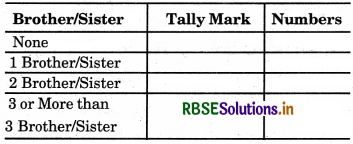
(1) How many students do not have any brother or sister?
(2) How many students have only one brother or sister?
(3) What is the number of brothers/ sister having maximum numbers of tally marks in front of them.
(4) How many students have 3 or more than 3 brothers/sister?
Solution:
Table is as follows :
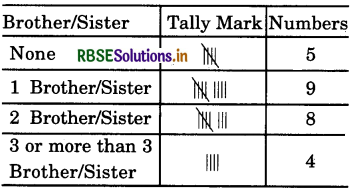
(1) 5 students do not have any brother or sister.
(2) 9 students have 1 brother or sister.
(3) 1 brother/sister have maximum tally marks.
(4) 4 students have 3 or more than 3 brothers/sister.

Question 3.
Attendance of students in R.P.V. Uperfila on Monday is shown in following table by  = 10 students and less than 10 students by tally marks.
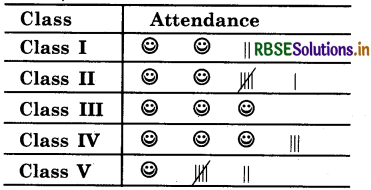
From table, it is clear that 22 students are present in class I since  = 10. Thus,
 || = 22.
1. Similarly, prepare a table of attendance of students of class II, III, IV and V.
2. In which class maximum students are present?
Solution:
1. From table, it is clear that attendance of students of class II, III, IV and V is as follows :
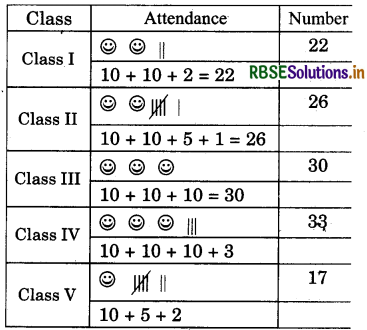
2. In class IV, attendance is maximum.

Exercise:
Question 1.
See the calendar of this year and draw bar chart for up coming holidays
Give answer of the following questions.
(i) Which month have maximum holidays?
(ii) Which month have minimum holidays?
(iii) In August or December which month have maximum holidays?
Solution:
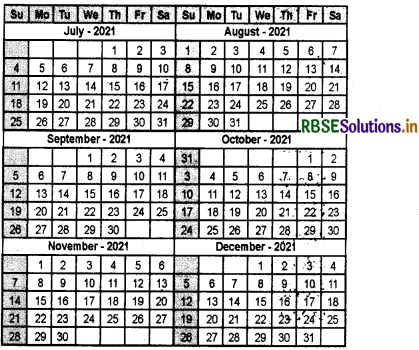
Give answer of the following questions.
(i) Which month have maximum holidays?
(ii) Which month have minimum holidays?
(iii) In August or December which month have maximum holidays?
Solution:

Note : Sunday is not taken as holiday.
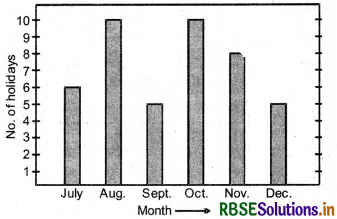
(i) October month has maximum holidays.
(ii) December month has minimum holidyas.
(iii) Out of August and December, August has maximum holidays.
Note : In the basis of change in number, of holidays, answer of this question may vary.

Question 2.
Number of papad made by self employed group of women is shown by following pictograph.
10 papad denoted by  and loose papad by sign.
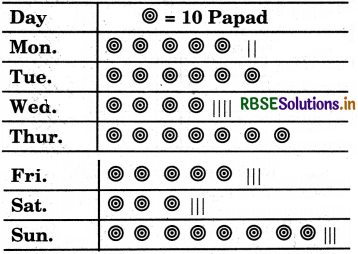
From the table, find.
(i) On which day maximum papad is prepared and how much?
(ii) Out of Monday and Friday, at which day maximum papad is prepared and how much?
Solution:
(i) From table, it is clear that maximum production of papad is on Sunday.
Their number = 8 × 10 + 3 = 80 + 3 = 83
(ii) Production of papad on Monday = 5 × 10 + 2 = 50 + 2 = 52
Production of papad on Friday = 5 × 10 + 3 = 50 + 3 = 53
It is clear that maximum production of papad is on Friday.
53 - 52 = 1 Thus, production of papad on Friday is 1 papad more than Monday’s production.

Question 3.
If  = 5 children and Tally marks | = 1, prepare a table of attendance for 1 week of your class and give answer of the following questions.
(i) Maximum attendance on which day?
(ii) Sum of 1 week attendance of students?
(iii) Minimum attendance an which day?
Solution:
Taking  = 5 children and tally marks | = 1, we prepare following table.
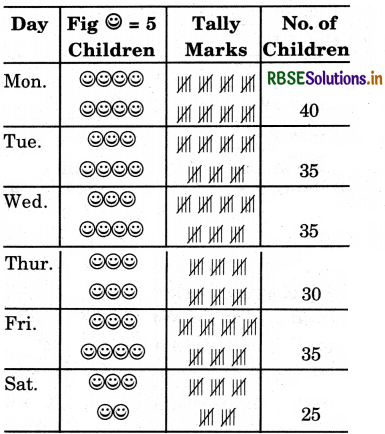
(i) Maximum attendance on Monday.
(ii) Total sum of weekly attendance = 40 + 35 + 35 + 30 + 35 + 25 = 200
(iii) Minimum attendance on Saturday.

Important Questions:
Multiple Choice Questions:
Question 1.
In bar chart, width of each column will be:
(a) similar
(b) different
(c) unequal
(d) None of these
Solution:
(a) similar
Question 2.
Tally mark for number 9 will be :

Solution:

Question 3.
If  = 3, then value of
  will be :
(a) 10
(b) 12
(c) 15
(d) 9
Solution:
(b) 12

Question 4.
Number 12 by tally mark, shown as:

Solution:

Question.
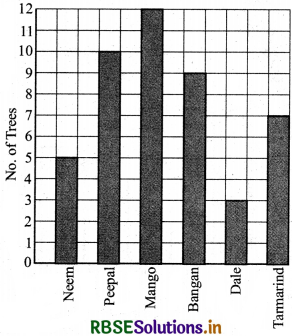
Observe the following bar chart, Answer the following questions, bar chart for number, of trees :
Question 5.
How much papad tree is more than neem tree?
(a) 5
(b) 7
(c) 7
(d) 10
Solution:
(a) 5
Question 6.
Total number of neem and date trees are :
(a) 5
(b) 8
(c) 11
(d) 15
Solution:
(b) 8

Question 7.
Total number of trees are :
(a) 42
(b) 44
(c) 46
(d) 48
Solution:
(c) 46
Question 8.
How much banyan trees is less than mango trees ?
(a) 9
(b) 7
(c) 5
(d) 3
Solution:
(d) 3

Short Answer Type Questions:
Question 1.
One day Guruji take class lest of Mathematics. 50 students were present on that day. There was 20 questions in test paper, each of 1 mark. Marks obtained by each student is given in the following table.
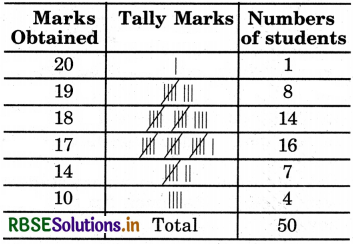
By observing above table, answer the following questions.
1. How many students got maximum marks ?
2. How many students got minimum marks?
3. How many students got 18 marks?
4. How many students were present in class test?
5. How many students got 18, 19, 20 marks?
Solution:
1. One student
2. 4 students.
3.14 students.
4 50 students.
5. 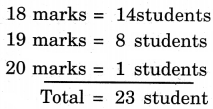
Total = 23 student Thus, 23 students got 18, 19, 20 marks.

Question 2.
Following pictograph shows number of students absent in class of 30 students last week.
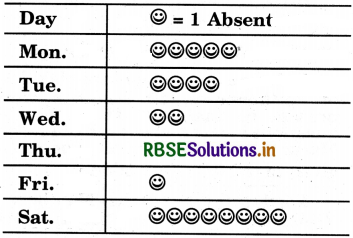
(a) On which day maximum students were absent? .
(b) Which day attendance was full?
(c) How many student were absent in this week?
Solution:
(a) On Saturday, maximum students were absent. (Maximum figure on this day.)
(b) On Thursday, attendance was full (On Thursday, there is no figure.)
(c) 20 students were absent in this week (total figures are 20.)
Question 3.
Following pictograph shows colour selection by persons, purchasing clothes for wedding in a village.
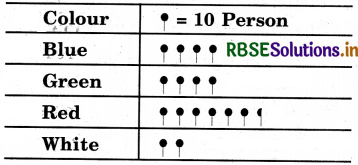
From above pictograph, answer the following questions.
(a) How many person like blue colour?
(b) How many person like red colour?
Solution:
(a) 40 persons like blue colour.
[  = 10 person, so 4 fig. 4 × 10 = 40 person ]
(b) To get number of persons who like red colour :
5 complete figure 5 × 10 = 50 person
Last incomplete figure = 5 person
Total = 50 + 5 = 55 persons

Question 4.
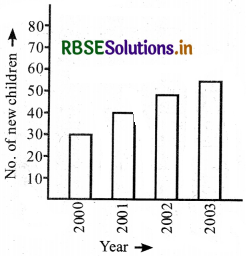
Make a bar chart from the table of new children who take admission in class 5 of a school every year.

1. In which year the maximum number of new admission took place?
2. How many new admission took place in 2001 ?
3. How many new admission took place in 2002 ?
Solution:
1. Most admission took place in 2003.
2. 40 new admission took place in 2001
3. 48 new admission took place in 2002

Question 5.
Observe the following bar chart and answer the following questions.
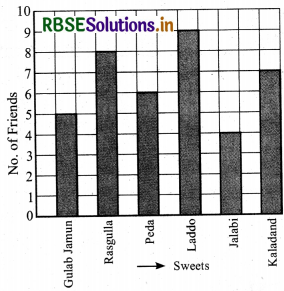
(i) How many friends like kalakand ?
Solution:
7 friends.
(ii) How many friends like sweets?
Solution:
Total friends = 5 + 8 + 6 + 9 + 4 + 7 = 39 friends.
(iii) Which sweet, friends like most ?
Solution:
Laddo, 9 friends like laddoo.
(iv) Name the sweet which is equally like by ?
Solution:
No such sweets.
(v) Which sweet friends like least?
Solution:
Jalebi, only 4 friends.
(vi) How many friends like both laddo and jalebi?
Solution:
Laddoo = 9 friends
Jalebi = 4 friends
Total = 13 friends
Thus, 13 frinds like laddo and jalebi.
(vii) What is the difference between the friends who like laddoo and gulab jamun ?
Solution:
Laddo = 9 friends
Gulab jamun = 5 friends
Difference = 9 - 5 = 4 friends
Thus, required difference = 4.

Question 6.
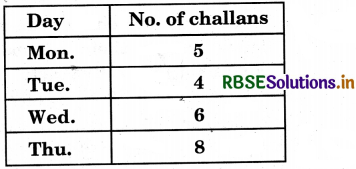
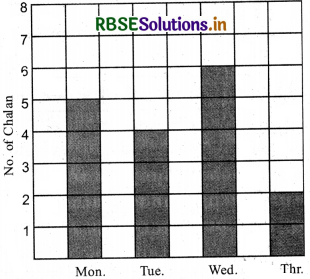
Following table shows number of challan for not follow the traffic rules at any crossing, by traffic police in Jaipur :
Solution:
Question 7.
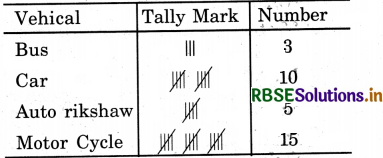
The number of vehicles registered in a day in Sikar city is shown in the following table :
Give the Answers of the following:
1. How many cars are registered?
2. Which vehical is least registered?
3. What is the maximum number and name of the registered vehicle?
4. How many vehicals are registered in total?
Solution:
1. 10,
2. Bus,
3. Motor Cycle,
4. 3 + 10 + 5 + 15 = 33 vehical

Question 8.
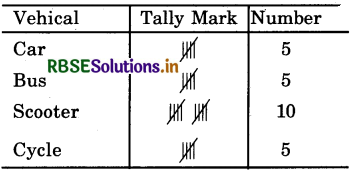
Some name of vehicles are given below. Show their number in table using the tally mark.
Car, Scooter, Cycle, Bus, Scooter, Car, Cycle, Scooter, Bus, Cycle, Car, Scooter, Scooter, Bus, Car, Scooter, Scooter, Cycle, Bus, Scooter, Car, Scooter, Cycle, Scooter, Bus.
Solution:
