RBSE Solutions for Class 11 Economics Chapter 7 Correlation
Rajasthan Board RBSE Solutions for Class 11 Economics Chapter 7 Correlation Textbook Exercise Questions and Answers.
RBSE Class 11 Economics Solutions Chapter 7 Correlation
RBSE Class 11 Economics Correlation Textbook Questions and Answers
Question 1.
The unit of correlation coefficient between height in feet and weight in kg is:
(i) kg/feet
(ii) percentage
(iii) non-existent
Answer:
(iii) The unit of correlation coefficient between height in feet and weight in kg is non-existent.

Question 2.
The range of simple correlation coefficient is:
(i) 0 to infinity
(ii) minus one to plus one
(iii) minus infinity to infinity
Answer:
(ii) The range of simple correlation coefficient is minus one to plus one.
Question 3.
If rxy is positive the relation between X and Y will be:
(i) When Y increases X increases
(ii) When Y decreases X increases
(iii) When Y increases X does not changes
Answer:
(ii) When Y increases X increases
Question 4.
If r = 0 the variable X and Y are:
(i) linearly related
(ii) not linearly related
(iii) independent
Answer:
(ii) If r = 0 the variable X and Y are not linearly related.
Question 5.
Of the following three measures which measure can be used in any type of relationship
(i) Karl Pearson’s coefficient of correlation
(ii) Spearman’s rank correlation
(iii) Scatter diagram
Answer:
Karl Pearson’s coefficient of correlation can be used in any type of relationship.

Question 6.
If precisely measured data are available the simple correlation coefficient is .................
(i) More accurate than rank correlation coefficient
(ii) Accurate than rank correlation coefficient
(iii) As accurate as the rank correlation coefficient
Answer:
(iii) If precisely measured data are available the simple correlation coefficient is as accurate as the rank correlation coefficient.
Question 7.
Why r is preferred than covariance as a measure of association?
Answer:
Both correlation coefficient (r) and covariance are measures of linear association. However, r is a scaled version of covariance. Correlation coefficient is a standardised and unitless measure. It removes the effect of the variance of the variables. Hence, it helps to compare one correlation to any other correlation and determine which one is stronger. This is not possible with covariance.
Question 8.
Can r lie outside the - I and I range depending on the type of data?
Answer:
No, the value of correlation coefficient (r) cannot lie outside the - I and I range. For any type of data, it strictly lies in the range -1 and +1, that is, -1 < r < +1. If the value of r is outside this range then there must be an error in calculation.
Question 9.
Does correlation imply causation?
Answer:
No, correlation does not imply causation. Correlation should never be interpreted as implying cause and effect relationship. Correlation only studies and measures the direction and intensity of relationship among variables.
Question 10.
When is rank correlation more precise than simple correlation coefficient?
Answer:
Rank correlation is more precise than simple correlation coefficient when:
(i) the measurements of the variables are uncertain; or
(ii) ranks need to be assigned to individual items according to their attributes; or
(iii) there are extreme values in the data.

Question 11.
Does zero correlation mean independence?
Answer:
Zero correlation implies that there is no linear correlation existent between the two variables. However, there may be some other type of relation between them. Thus, zero correlation does not mean independence.
Question 12.
Can simple correlation coefficient measure any type of relationship?
Answer:
Simple correlation coefficient can measure only quantitative relationship between two variables. However, it cannot measure the relationship if the variables are expressed in term of attributes or there are more than two variables.
Question 13.
Collect the price of five vegetables from your local market every day for a week. Calculate their correlation coefficients. Interpret the result.
Answer:
The table below shows the calculations to find out the correlation coefficient between potato and cabbage.
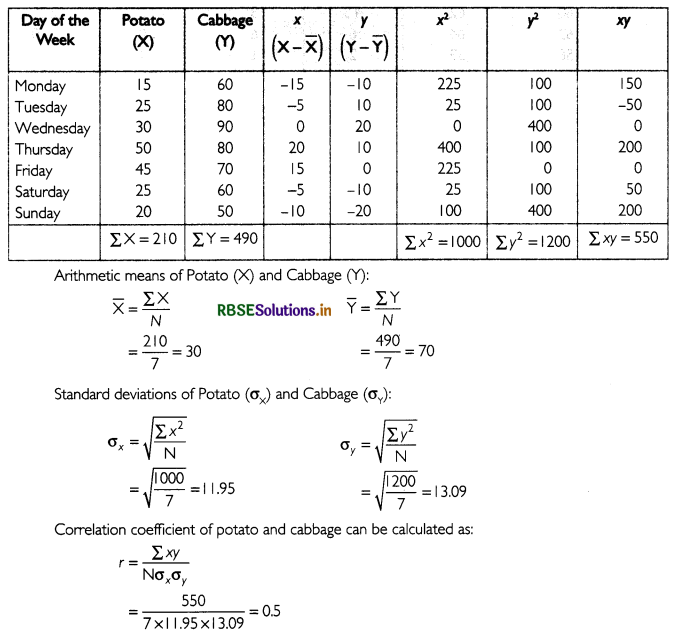
The value of correlation coefficient is 0.5. This implies that there is a positive correlation between potato and cabbage.
Note: Find out the prices of 3 more vegetables in the similar way and calculate their correlation coefficients.

Question 14.
Measure the height of your classmates. Ask them the height of their benchmate. Calculate the correlation coefficient of these two variables. Interpret the result.
Answer:
The table below shows the heights of the classmates and their respective benchmate. Rank has been assigned to each classmate.
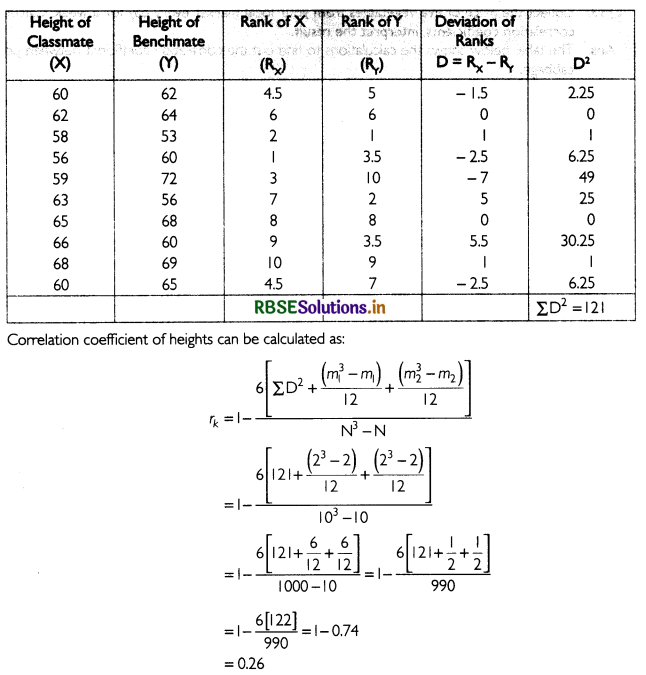
The correlation coefficient of the heights of the classmates and their respective benchmate is 0.26.

Question 15.
List some variables where accurate measurement is difficult.
Answer:
Accurate measurement is difficult for qualitative aspects such as honesty, intelligence, beauty, dedication, etc.
Question 16.
Interpret the values of r as I, - I and 0.
Answer:
If the value of r = I then there is perfect positive correlation between X and Y.
If the value of r = - I then there is perfect negative correlation between X and Y.
If r = 0 then there is no correlation between X and Y.
It can be interpreted with the help of following diagram:
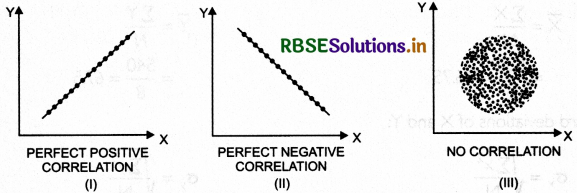
In figure (i), all the points lie on the line in the upward direction. This shows perfect positive correlation between X and Y.
In figure (ii), all the points lie on the line in the downward direction. This shows perfect negative correlation between X and Y.
In figure (iii), points do not form any pattern. This shows no correlation between X and Y.

Question 17.
Why does rank correlation coefficient differ from Pearsonian correlation coefficient?
Answer:
Rank correlation coefficient (rk) differs from Pearsonian correlation coefficient (r) in the following ways:
|
Rank Correlation Coefficient |
Pearsonian Correlation Coefficient |
|
1. It can be used for finding correlation coefficient between qualitative variables. |
It cannot be used for finding correlation coefficient between qualitative variables. |
|
2. It cannot be used for finding correlation coefficient for grouped frequency distribution. |
It can be used for finding correlation coefficient for grouped frequency distribution. |
|
3. It can be used in case of extreme values. |
It cannot be used in case of extreme values. |
Question 18.
Calculate the correlation coefficient between the heights of fathers in inches (X) and their sons (Y).

Answer:
The table below shows the calculations to find out the correlation coefficient between X and Y.
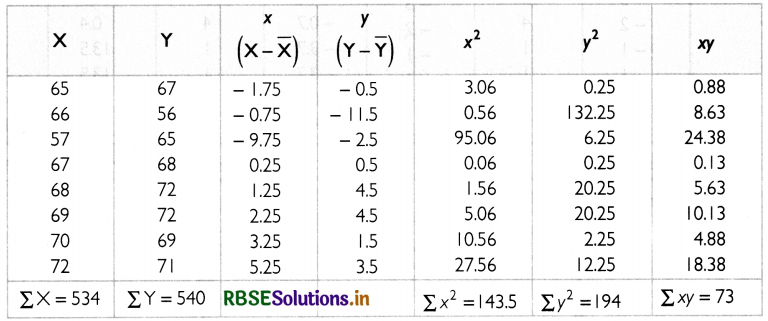
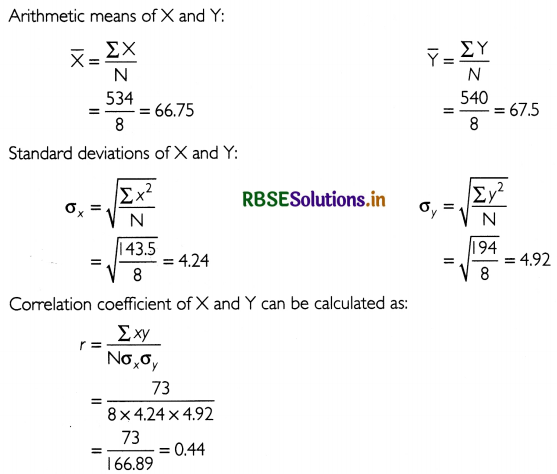
The value of correlation coefficient is 0.44. This implies that there is low positive correlation between X and Y.

Question 19.
Calculate the correlation coefficient between X and Y and comment on their relationship:

Answer:
The table below shows the calculations to find out the correlation coefficient between X and Y.
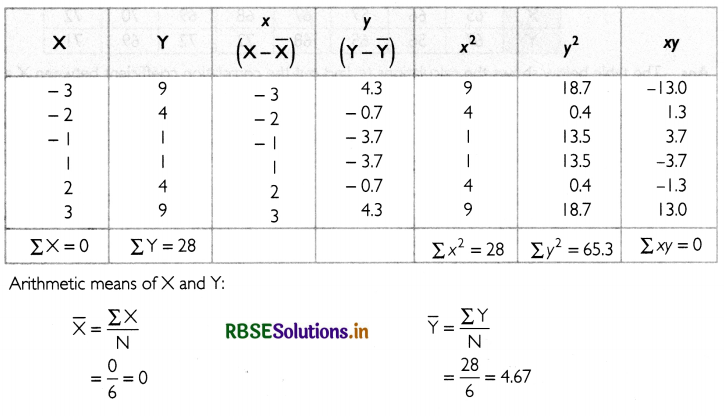
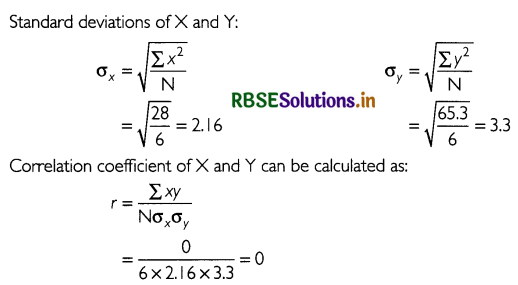
The value of correlation coefficient is 0. This implies that there is perfect positive correlation between X and Y.

Question 20.
Calculate the correlation coefficient between X and Y and comment on their relationship:

Answer:
The table below shows the calculations to find out the correlation coefficient between X and Y.
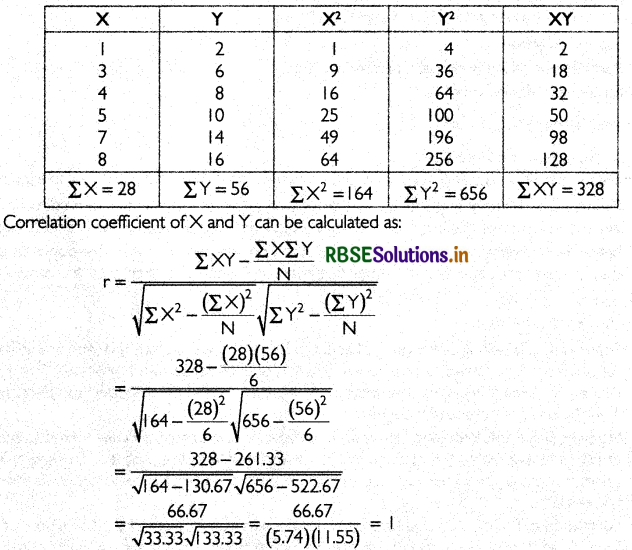
The value of correlation coefficient is I. Ths implies that there is perfect positive correation between X and Y.
