RBSE Class 11 Economics Important Questions Chapter 3 Organisation of Data
Rajasthan Board RBSE Class 11 Economics Important Questions Chapter 3 Organisation of Data Important Questions and Answers.
Rajasthan Board RBSE Solutions for Class 11 Economics in Hindi Medium & English Medium are part of RBSE Solutions for Class 11. Students can also read RBSE Class 11 Economics Important Questions for exam preparation. Students can also go through RBSE Class 11 Economics Notes to understand and remember the concepts easily.
RBSE Class 11 Economics Important Questions Chapter 3 Organisation of Data
Very Short Answer Type Questions
Organisation Of Data Class 11 Extra Questions And Answers Question 1.
Define classification of data.
Answer:
Classification of data is the process of organising the raw data into groups or classes to facilitate further statistical analysis.
Organisation Of Data Class 11 Important Questions Question 2.
List the methods of classification of data.
Answer:
The methods of classification of data are:
(i) Chronological classification
(ii) Geographical classification
(iii) Qualitative classification
(iv) Quantitative classification

Important Questions Of Organisation Of Data Class 11 Question 3.
When is data said to be raw?
Answer:
Data is said to be raw when it is not arranged in a systematic order.
Class 11 Statistics Chapter 3 Important Questions With Answers Question 4.
Give an example of geographical classification.
Answer:
An example of geographical classification - Data related to the sugar production in various states of India.
Class 11 Statistics For Economics Chapter 3 Important Questions Question 5.
Define qualitative classification and give an example,
Answer:
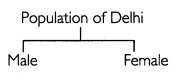
In qualitative classification, data is classified on the basis of certain attributes. For example, population of Delhi can be classified into males and females:
Organisation Of Data Important Questions Question 6.
Give one point of difference between qualitative and quantitative classification.
Answer:
In qualitative classification, data is classified on the basis of certain attributes; while in quantitative classification, data is classified in numerical terms.
Organisation Of Data Class 11 Numericals Question 7.
State one point of difference between chronological and spatial classification.
Answer:
In chronological classification, data is classified in ascending or descending order with reference to time; while in spatial classification, data is classified according to geographical locations.
Questions On Organisation Of Data Class 11 Question 8.
What is a variable?
Answer:
Variables are those facts which can be presented in numeric form and may assume more than one set of values.
Organisation Of Data Class 11 Questions And Answers Question 9.
Define discrete variable.
Answer:
A discrete variable can take only certain values. Its value changes only by finite ‘jumps’ from one value to another but does not take any intermediate value between them.
Organisation Of Data Class 11 Questions Question 10.
What is a continuous variable?
Answer:
A continuous variable can take any numerical value. Continuous variable may take integral values, fractional values and values that are not exact fractions.
Class 11 Economics Statistics Chapter 3 Questions And Answers Question 11.
Define series.
Answer:
A series, as used statistics, may be defined as things or attributes of things arranged according to some logical order.
Important Questions From Organisation Of Data Class 11 Question 12.
State one feature of inclusive series?
Answer:
Inclusive method does not exclude the upper class limit in a class interval and hence, both class limits are parts of the class interval.
Statistics For Economics Class 11 Chapter 3 Questions And Answers Question 13.
What is an open-end series?
Answer:
In open-end series, either the lower limit of the first class interval or the upper limit of the last class interval is missing.
Class 11 Economics Chapter 3 Organisation Of Data Question Answer Question 14.
Write one function of tally marks.
Answer:
Tally marks keep quick track of numbers in groups of five.
Question 15.
What are the two ends of a class called?
Answer:
The two ends of a class are called class limits.
Question 16.
Give another name for class interval.
Answer:
Class width is another name for class interval.
Question 17.
Write the formula for calculating class mid-point.
Answer:
Class mid-point is calculated as:
\(\frac{\text { Upper class limit }+\text { Lower class limit }}{2}\)
Question 18.
Define range.
Answer:
Range is the difference between the largest and the smallest value of a variable.
Short Answer Type Questions
Question 1.
What are the objectives of classification?
Answer:
The following are the main objectives of classification:
(i) It makes data comparable.
(ii) It makes data more attractive and effective.
(iii) It presents the data into brief, simple and logical forms.
(iv) It enhances the utility of data as it brings similarity in the diverse set of data.
(v) It draws differences among the data.
Question 2.
State the features of a good classification.
Answer:
The following are the features of a good classification:
(i) Classification should be widespread so that the collected data can be grouped.
(ii) It should dearly indicate the group to which it belongs.
(iii) It must be homogeneous, i,e. in a group each item must be similar.
(iv) A good classification must be stable. It means that during the whole investigation, internal classification remains the same.
(v) A good classification is done as per the objective of investigation.
Question 3.
Explain chronological classification of data with the help of an example.
Answer:
In chronological classification, data is classified in ascending or descending order with reference to time such as days, weeks, months, quarters, years, etc. The table below shows the exports of Maruti Suzuki cars in terms of years:
Exports of Maruti Suzuki Car
|
Year |
Sale (In Units) |
|
2004 - 2005 2005 - 2006 2006 - 2007 2007 - 2008 2008 - 2009 2009 - 2010 2010 - 2011 2011 - 2012 |
48,899 34,784 39,295 53,024 70,023 147,575 138,266 127,379 |
Question 4.
Give two examples each of a discrete and continuous variable.
Answer:
Examples of a discrete variable: Number of members in family, results of rolling a dice, goals in a hockey match
Examples of a continuous variable: Height, weight, temperature
Question 5.
State some features of discrete variable.
Answer:
The following are some features of discrete variable:
(i) A discrete variable can take only certain values,
(ii) Its value changes by finite “jumps".
(iii) It does not take any intermediate value.
Question 6.
Give two examples each of a discrete and continuous variable.
Answer:
Examples of a discrete variable: Number of members in family, results of rolling a die, goals in a hockey match
Examples of a continuous variable: Height, weight, temperature
Question 7.
State some features of discrete variable.
Answer:
The following are some features of discrete variable:
(i) A discrete variable can take only certain values,
(ii) Its value changes by finite “jumps".
(iii) It does not take any intermediate value.
Question 8.
Looking at the class interval below, answer the questions that follow.
(i) What is the class size?
(ii) Define class frequency.
(iii) What is the lower limit of the given class?
(iv) Calculate the mid-point of the given class interval.
|
Class Interval |
Frequency |
|
60-70 |
8 |
Answer:
(i) The class size is 10.
(ii) Class frequency is the number of values in a particular class. For instance, the number of values in the class 60 - 70 is 8.
(iii) The lower limit of the given class is 60.
(iv) Class mid-point can be calculated as:
\(\frac{\text { Upper class limit }+\text { Lower class limit }}{2}=\frac{60+70}{2}=\frac{130}{2}=65\)
Question 9.
Suggest the steps for preparing a frequency distribution.
Answer:
The steps for preparing a frequency distribution are given below:
(i) Find out the extent to which a variable changes its value.
(ii) Determine the number of classes.
(iii) Determine the class size.
(iv) Choose the class limits.
(v) Obtain the frequency for each class.
Question 10.
Write a short note on ‘range’.
Answer:
Range is the difference between the largest and the smallest values of the variable. A large range indicates that the values of the variable are widely spread while a small range indicates that the values of the variable are narrowly spread. If the class intervals are equal then range is the product of the number of classes and class interval of a single class.
Range = Number of Classes x Class Interval
Question 11.
How can you obtain the class frequency?
Answer:
Class frequency is the number of values in a particular class. A tally (/) is put against a class for each observation whose values are included in that class. For example, if the income of a household is ₹ 16,000, we put a tally (/) against class 10,000 - 20,000. Similarly, if the income of a household is ₹ 32,500, we put a tally (/) against class 30,000 - 40,000. Tally marks keep quick track of numbers in groups of five. Thus, frequency in a class is equal to the number of tallies against that class.
Question 12.
When is frequency distribution with unequal classes more appropriate?
Answer:
When the classes are to be formed in such a way that class marks coincide to a value around which the observations in a class tend to concentrate then it is more appropriate to use unequal class interval.
Question 13.
Why is there no class mark in a discrete frequency distribution?
Answer:
Frequency array is the classification of data related to discrete variables. A discrete variable takes only integral values, that is, it does not take any fractional value between two adjacent integral values. Thus, there are no classes in a frequency array. Absence of classes implies no class intervals. Since the classes are absent in a discrete frequency distribution, there is no class mark as well.
Long Answer Type Question
Question 1.
Explain in detail the various methods of classification of data.
Answer:
The methods of classification are shown with the help of the following flowchart:
(i) Geographical Classification: In geographical classification, data is classified according to geographical locations. The table below shows data related to sugar production in different states of India.
Sugarcane Production in 5 Indian States
|
State |
Sugarcane Production (Metric ton) |
|
Punjab |
1,000 |
(ii) Chronological Classification: In chronological classification, data is classified in ascending or descending order with reference to time such as days, weeks, months, quarters, years, etc. The table below shows the exports of Maruti Suzuki cars in terms of years:
Exports of Maruti Suzuki Car
|
Year |
Sale (In Units) |
| 2007 - 2008 2008 - 2009 2009-2010 2010 - 2011 2011 -2012 |
53,024 70,023 147,575 138,266 127,379 |
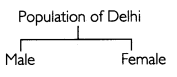
(iii) Qualitative Classification: In this type of classification, data is grouped according to their qualities like colour, size or any other quality. This type of classification is done when direct measurement is not possible. For example, population of Delhi can be classified into males and females:
Frequency Distribution of Monthly Incomes of 50 Households in a Locality
(iv) Quantitative Classification: In this type of classification, data is classified on the basis of numeric value. The table below shows the frequency distribution of monthly incomes of 50 households in a locality.
Frequency Distribution of Monthly Incomes of 50 Households in a Locality
|
Class Interval |
Frequency |
| Below - 20,000 20,000 - 30,000 30,000 - 40,000 40,000 - 50,000 Above - 50,000 |
18 |
|
Total |
50 |
Question 2.
Define inclusive series and exclusive series. How can an inclusive series be converted into an exclusive series?
Answer:
In exclusive method of classification of data, classes are formed in such a way that the lower limit of a class coincides with the upper class limit of the previous class. Thus, an observation which is exactly equal to the upper class limit would not be included in that class but in the next class. On the other hand, if it was equal to the lower class limit then it would be included in that class. Inclusive method does not exclude the upper class limit in a class interval and hence, both class limits are parts of the class interval. Consider the given frequency distribution for conversion from inclusive to exclusive class.
|
Class Interval |
Frequency |
| 10- 19 20-29 30-39 40-49 50-59 |
0 3 2 3 2 |
|
Total |
10 |
The following are the steps for converting an inclusive series into an exclusive one:
(i) Find the difference between the lower limit of the second class and the upper limit of the first class. In the given table, the lower limit of the second class is 10 and the upper limit of the first class is 9. The difference between them is I (10 - 9 = 1).
(ii) Divide the difference obtained in (i) by two (1/2 = 0.5).
(iii) Subtract the value obtained in (ii) from lower limits of all the classes.
(iv) Add the value obtained in (ii) to upper limits of all the classes.
The table obtained after adjustment is as below:
|
Class Interval |
Frequency |
| 9.5 — 19.5 19.5 — 29.5 29.5 — 393 39.5 — 49.5 49.5 — 59.5 |
5 3 2 3 2 |
|
Total |
15 |
Question 3.
Define mid-value series. Describe the steps of converting a mid-value series into a simple series.
Answer:
In mid-value series, only the mid-values of each class interval are given.
For example:
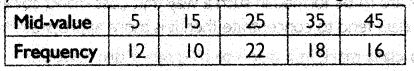
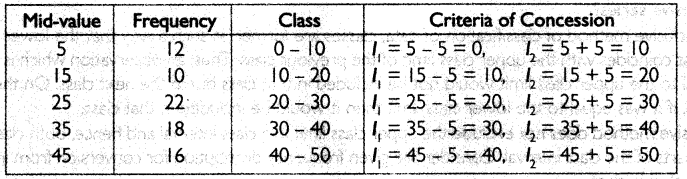
The following are the steps for converting a mid-value series into a simple series:
(i) Find the mutual difference between the mid-values.
The difference between them is 10 (15 - 5 = 10; 25 - 15 = 10; and so on).
(ii) Divide the difference obtained in (i) by two (10/2 = 5).
(iii) Subtract the value obtained in (ii) from the mid-values to obtain the lower limit for each class.
(iv) Add the value obtained in (ii) to the mid-values to obtain the upper limit for each class.
The table obtained after adjustment is as below:
Question 4.
Explain bivariate frequency distribution with the help of an example.
Answer:
The frequency distribution of two variables is called a bivariate frequency distribution. When a large number of pairs of observations are available, it becomes necessary to condense the data in the form of two-way frequency table. Such a table called is called bivariate frequency table. An example of a bivariate frequency table is given below.
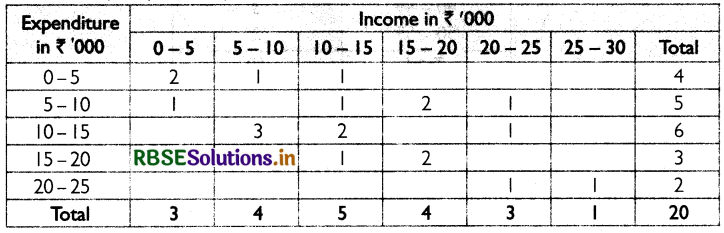
The table shows the frequency distribution of two variables - income and expenditure (in ₹) of 20 households. The values of incomes are classed in different columns and the values of expenditure are classed in different rows. Each cell shows the frequency of the corresponding row and column values. For example, there are 2 households whose incomes are between
₹ 15,000 - ₹ 20,000 and their expenditures are between ₹5,000 - ₹10,000.
Question 5.
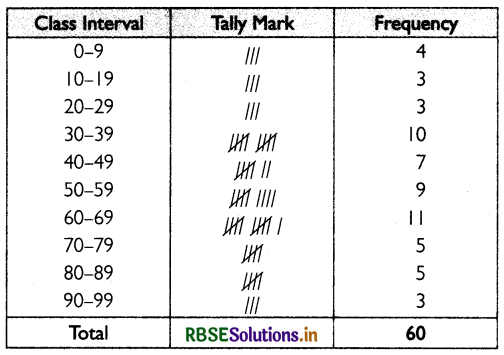
Present the following data of model of 60 students of class 12th in the form of frequency table with 10 equals width series with one of the series as 60-69.
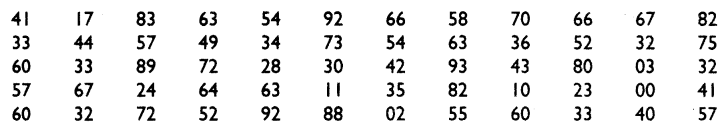
Answer:
The table below shows the frequency distribution:
Higher Order Thinking Skills
Question 1.
What is the inherent shortcoming of the cbssWkaton of data as a frequency distribution?
Answer:
The classification of data as a frequency distribution has an inherent shortcoming. While it summarises the raw data and makes it comprehensive and concise, it does not include the details found in a raw data. Loss of information takes place while classifying and organising raw data. Once the data are grouped into classes, an individual observation has no significance in further statistical calculations.
Question 2.
What is the principal objective of classification of data?
Answer:
The principal objective of classification of data is to capture and distinctively present the diverse features of data. ft is not done in an arbitrary manner and hence, saves time and effort.
Choose the correct answer:
Question 1.
Which among the following is a discrete variable?
(A) 2
(B) 2.25
(C) 2.5
(D) √2
Answer:
(A) 2
Question 2.
Which of the following is not a base for class&ation?
(A) Quality
(B) Value
(C) Size
(D) On
Answer:
(C) Size
Question 3.
What the difference between the upper class limit and the lower class limit called?
(A) Class interval
(B) Class Frequency
(C) Class limit
(D) Class mark
Answer:
(A) Class interval
Question 4.
How many types of variables are there?
(A) Two
(B) Three
(C) Four
(D) Five
Answer:
(A) Two
Question 5.
What is the formula of range?
(A) L - H
(B) H - L
(C) \(\frac{H+L}{2}\)
(D) \(\frac{H-L}{2}\)
Answer:
(B) H - L
Question 6.
Mid-value of a class is given by:
(A) l1 - l2
(B) l2 - l1
(C) \(\frac{I_1+I_2}{2}\)
(D) \(\frac{I_1-I_2}{2}\)
Answer:
(C)
Question 7.
What type of classification is the grouping of population as either literate or illiterate?
(A) Geographical
(B) Quantitative
(C) Chronological
(D) Qualitative
Answer:
(D) Qualitative
Question 8.
Number appearing on a dice is an example of
(A) Chronological data
(B) Continuous variable
(C) Qualitative data
(D) Discrete variable
Answer:
(D) Discrete variable
Question 9.
What is the formula for range if the class intervals are equal?
(A) Number of Gasses - Class Interval
(B) Number of Classes X Class Interval
(C) Number of Gasses + Class Interval
(D) Number of Classes ÷ Class Interval
Answer:
(B) Number of Classes X Class Interval
Question 10.
What does the image below represent?
(A) Raw data
(B) Univariate frequency distribution
(C) Bivarinate frequency distribution
(D) Frequency Curve
Answer:
(C) Bivarinate frequency distribution
I. Fill in the blanks with correct answer.
1. ____ is the act of grouping related facts into different classes.
2. Data is said to be____ when ft is not arranged in a systematic order.
3. There are ____ the types of classification.
4. In classification, data is classified in ascending or descending order with reference to time.
5. ____ variables can take any value ____ integral or fraction.
6. The lower limit in class 10 -15 is ____
7. The frequency distribution of two variables is known as ____ distribution.
8. Frequency array is related with ____ senes.
9. Both class limits are parts of the class interval in ____ senes.
10. Tally marks keep quick track of numbers in groups of ____
Answers:
1. Classification
2. raw
3. four
4. chronological
5. Continuous
6. 10
7. bivanate
8. discrete
9. inclusive
10. Five
II. State whether the following statements are true or false.
1. Unarranged information s called raw data.
2. Continuous variables take only certain values.
3. The frequency distribution of two variables is called a univanate frequency distribution.
4. Tally marks keep quick track of numbers in groups of three.
5. Class md-point is obtained by adding the lower and upper limits of a class and dividing the sum by two.
6. Frequency is the number of times a value occurs in the raw data
7. Result of tossing a coin is an example of continuous variable.
8. In exclusive senes, lower limit is excluded.
9. Absence of classes implies no class intervals.
10. Class intervals of the type 30-39. 40-49, 50-59 represents inclusive type.
Answer:
1. True
2. False
3. False
4. False
5. True
6. True
7. False
8. False
9. True
10. True
III. Match the following.
|
Column - I. |
Column - II. |
|
1. Classification 2. Spatial Classification 3. Discrete variables 4. Continuous variables 5. Frequency 6. Tally mark 7. Class interval 8. Frequency distribution 9. Range 10. Exclusive series 11. Inclusive series |
(A) Take only certain value (B) Take any value: Integral or fraction (C) Classifies raw data into quantitative variables (D) Related to geographical locations. (E) Process of organising the raw data into groups according their similarities and dissimilarities. (F) Highest value - Lowest value (G) 10-20 (H) line representation of a number (l) 10 -19 (J) Difference between upper class limit and lower class limit (K) Number of times a value occurs in the raw data. |
Answers: 1. (E), 2. (D), 3. (A), 4. (B), 5. (K), 6. (H) 7.(J), 8. (C), 9. (F), 10. (G), 11.(I)
IV. Read the following statement- Assertion (A) and Reason (R). Choose one of the correct alternatives given below:
Assertion (A): A discrete variable can take only certain value.
Reason (R): Discrete variable may take integral values.
Alternatives:
(a) Both Assertion (A) and Reason (R) are true and Reason (R) is the correct explanation of Assertion (A).
(b) Both Assertion (A) and Reason (R) are true and Reason (R) is not the correct explanation of Assertion (A).
(c) Assertion (A) is true and Reason (R) is false.
(d) Assertion (A) is false and Reason (R) is true.
Answer:
(c) Assertion (A) is true and Reason (R) is false.
V. Read the following hypothetical case study carefully and answer the following questions on the base of the same:
The groups or classes of a classification can be prepared in various ways. Instead of classifying your books according to subjects History, Geography, Mathematics, Science, etc. you could classify items author-wise in an alphabetical order. Or, you could also classify them according to the year of publication. The way you want to classify them would depend on your requirement. Likewise the raw data could be classified in various ways depending on the purpose in hand. They can be grouped according to time. Such a classification is known as a chronological classification.
1. ............ of data is the process of organising the raw data into groups or classes to facilitate further statistical analysis. (Classification/Collection)
2. Unarranged or unclassified information is called data, (secondary/raw)
3. Data is classified in ascending or descending order with reference to ............. is called chronological classification, (time/locations)
4. ............. data is classified on the basis of numerical value. (Quantitative/Qualitative)
Answers:
1. Classification
2. raw
3. time
4. Quantitative

- RBSE Class 11 Economics Important Questions Chapter 9 पर्यावरण और धारणीय विकास
- RBSE Class 11 Economics Important Questions Chapter 2 Collection of Data
- RBSE Class 11 Economics Important Questions Chapter 4 Presentation of Data
- RBSE Class 11 Economics Important Questions Chapter 1 Introduction to Statistics for Economics
- RBSE Class 11 Economics Important Questions Chapter 6 Measures of Dispersion
- RBSE Class 11 Economics Important Questions in Hindi & English Medium
- RBSE Class 11 Economics Important Questions Chapter 8 Index Numbers
- RBSE Class 11 Economics Important Questions Chapter 7 Correlation
- RBSE Solutions for Class 11 Economics in Hindi Medium & English Medium
- RBSE Class 11 Economics Important Questions Chapter 5 Measures of Central Tendency
- RBSE Solutions for Class 11 Economics Chapter 7 Correlation