RBSE Class 11 Economics Important Questions Chapter 7 Correlation
Rajasthan Board RBSE Class 11 Economics Important Questions Chapter 7 Correlation Important Questions and Answers.
Rajasthan Board RBSE Solutions for Class 11 Economics in Hindi Medium & English Medium are part of RBSE Solutions for Class 11. Students can also read RBSE Class 11 Economics Important Questions for exam preparation. Students can also go through RBSE Class 11 Economics Notes to understand and remember the concepts easily.
RBSE Class 11 Economics Important Questions Chapter 7 Correlation
Very Short Answer Type Questions
Question 1.
Define correlation.
Answer:
Correlation is a statistical measure that shows the degree to which two or more variables fluctuate in relation to one another.
Question 2.
How many types of correlation are there?
Answer:
Correlation is mainly classified into two types - positive correlation and negative correlation.

Question 3.
What happens when there is a negative correlation between variables X and Y?
Answer:
When there is negative correlation between variables X and Y then as X increases, Y decreases or as X decreases, Y increases. In simple terms, negative correlation between variables X and Y implies that variables move in opposite direction.
Question 4.
Give an example of positive correlation.
Answer:
Example of positive correlation: temperature and sale of cold drinks
Question 5.
List the various techniques of measuring correlation.
Answer:
The various techniques of measuring correlation
(i) Scatter diagram
(ii) Karl Pearson’s Coefficient of Correlation
(iii) Spearman’s Rank Correlation
Question 6.
What is scatter diagram?
Answer:
Scatter diagram graphically shows the direction and degree of correlation between variables.
Question 7.
What is the fine of best fit?
Answer:
The line of best it is the one that passes through the scattered points such that it represents most of their points.
Question 8.
State one shortcoming of scatter diagram.
Answer:
Scatter diagram does not measure the precise extent of correlation.
Question 9.
What type of correlations exists between variables if points lie very close to the line of best fit in an upward direction
Answer:
If points lie very close to the line of best fit in an upward direction, there exists high positive linear correlation between the variables.
Question 10.
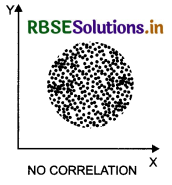
Draw a diagram showing no correlation between two variables.
Answer:
Diagram showing no correlation between two variables:
Question 11.
Define Kart Pearson’s coefficient of correlation.
Answer:
Karl Pearson’s coefficient of correlation gives the numerical value of the degree of correlation between two variables.
Question 12.
State any one property of correlation coefficient.
Answer:
Correlation coefficient (r) does not have a unit, that is, it is a pure number.
Question 13.
Give the formula for calculating correlation coefficient.
Answer:
Karl Pearson's measure of correlation (r) is given by:\(r=\frac{\sum x y}{N \sigma_x \sigma_y}\)
where; X = \(\bar{X}\) — X and y = \(\bar{Y}\)
Question 14.
What is the nature of correlation if the value of r is - 1?
Answer:
When r is - 1, there is perfect negative correlation between variables.
Question 15.
What is the value of r if the two variables are not related
Answer:
When the two variables are not related, r = 0.
Question 16.
How does Spearman’s rank correlation measure relation between variables’
Answer:
Spearman’s rank correlation measures the linear relation between ranks assigned to individual items according to their attributes.
Question 17.
Name some qualitative variables.
Answer:
Examples of qualitative variables include beauty, wisdom, bravery, dedication, honesty, etc.
Question 18.
Who developed Spearman’s rank correlation’
Answer:
Spearman’s rank correlation was developed by British psychologist C.E Spearman.
Question 19.
State the formula to find Spearman’s correlation.
Answer:
Spearman’s rank correlation (rk) is given by:
\(r_k=1-\frac{6 \sum D^2}{N^3-N}\)
Question 20.
When is rank correlation preferred to Pearsoniari coefficient’
Answer:
Rank correlation is preferred to the Pearsonian coefficient when extreme values are present
Question 21.
State the general relationship between rank correlation coefficient and Karl Pearson’s correlation coefficient.
Answer:
In general, rank correlation coefficient (rk) is less than or equal to (r).
Short Answer Type Questions
Question 1.
Explain the types of correlation.
Answer:
Correlation is mainly classified into two types - positive correlation and negative correlation.
(i) Positive Correlation: In positive correlation, two variables move in the same direction, that is, when one increases, the other also increases and when one decreases, the other also decreases.
(ii) Negative Correlation: In negative correlation, two variables move in the opposite direction, that is, when one increases, the other decreases and when one decreases, the other increases.
Question 2.
Discuss the importance of correlation.
Answer:
Importance of correlation:
(i) Formation and testing of Economic Laws: Correlation helps to study the relationship between various economic variables and hence, test the economic laws and principles. For example, the law of demand explains that when price of commodity increases, demand decreases and if price decreases, demand increases.
(ii) Studying Economic Problem: Correlation can be used to find out the cause behind an economic problem by explaining the reasons that are associated with the problem. For example, does price increase or decrease with rise is inflation. This problem can be tested with the help of correlation.
(iii) Formation of Policy: With the help of results derived from correlation, national policies can be formulated to deal with economic problems. For example, correlation can find out the reason behind the bounce in the prices. The government can formulate policies accordingly to curb price rise.
Question 3.
State the merits of scatter diagram.
Answer:
The merits of scatter diagram are:
(i) It is a very simple method of studying the correlation between two variables.
(ii) It indicates the relation between variables by gMng just a glance.
(iii) This method is not affected by extreme values in the data.
Question 4.
What are the demerits of scatter díagram?
Answer:
The demerits of scatter diagram are:
(i) A scatter diagram does not measure the precise extent of correlation.
(ii) It is not a quantitative measure of the relationship between the variables.
(iii) The relationship between more than two variables cannot be shown using scatter diagram.
Question 5.
With the help of an example, draw a scatter diagram showing perfect positive correlation.
Answer:
The given table shows that as the price of a pen increases, the number of units supplied also increases. That is, there is a posrtive relation between price and quantity supplied. The diagram along the table shows the scatter plot of price and number of pens supplied.
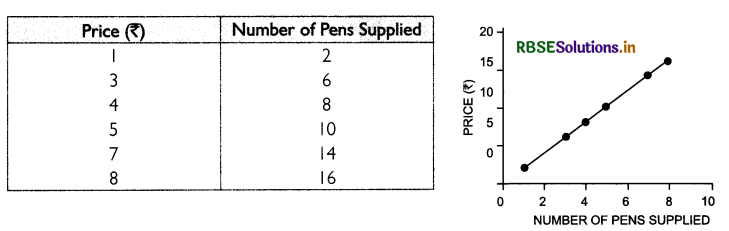
In the diagram, all the points lie on a line in an upward direction. Thus, there is a perfect positive correlation between price and number of pens supplied.
Question 6.
Draw diagrams showing:
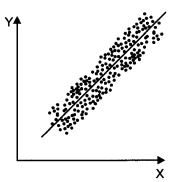
(i) high positive correlation
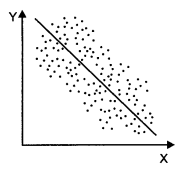
(ii) low negative correlation
Answer:
(i) In high positive correlation, points lie near the line or on the line upward direction as shown below.
(ii) In a low negative correlation, points are widely dispersed around the line in downward direction as shown below:
Question 7.
Mention the properties of correlation coefficient.
Answer:
Following are the important properties of correlation coefficient (r):
(i) r does not have any unit, that is, it is a pure number.
(ii) A negative value of r indicates an inverse relation while a positive value of r indicates a direct relation between two variables.
(iii) If r = 0, the two variables are uncorrelated.
(iv) If r = 1 or r = -1, there is perfect correlation between variables.
(v) The value of r indicates high linear relation when it is close to + 1 or - 1 while it indicates a weak relation when close to zero.
(vi) The value of r lies between -1 and + 1, that is, -1≤ r ≤ + 1
(vii) The value of r is not affected by the change of origin and change of scale.
Question 8.
State the merits of Karl Pearson’s correlation coefficient.
Answer:
The merits of Karl Pearson’s correlation coefficient are:
(i) It is a real measure of correlation coefficient as it is based on arithmetic mean and standard deviation.
(ii) It finds out not only the direction but also the actual degree of correlation between variables.
Question 9.
What are the demerits of Karl Pearson’s correlation coefficient.
Answer:
The demerits of Karl Pearson’s correlation coefficient are:
(i) The values of correlation coefficient are unduly affected by extreme values.
(ii) The assumption that there is a linear relation between variables is not always true.
(iii) The analysis of correlation coefficient requires a lot of care as there is a possibility of misinterpretation of results.
(iv) It involves long mathematical calculation and hence, is a time-consuming method.
Question 10.
Show the various degrees of correlation in a tabular form.
Answer:
The table below shows the various degrees of correlation:
|
Degree of Correlation |
Positive Correlation |
Negative Correlation |
|
Perfect |
+ 1 |
- 1 - : |
|
Limited |
Between 0.75 and 0.9 |
Between - 0.9 and - 0.75 |
|
Zero Correlation |
0 |
0 |
Long Answer Type Questions
Question 1.
Explain the different degrees of correlation.
Answer:
The different degrees of correlation are:
(i) Perfect Correlation: Perfect correlation exists when the values of two variables change in same ratio. This change can be ever negative or positive. If the variables change in equal ratio and same direction then the correlation would be perfectly positive and coefficient of correlation will also be positive. Similarly, if the variables change in equal ratios but opposite direction then correlation would be perfect negative and coefficient of correlation will also be negative.
(ii) Zero Correlation: There is zero correlation between two variables when the variables are not related. In this case, the correlation coefficient is zero.
(iii) Limited Degree of Correlation: There is a stage of limited degree of correlation between the perfect correlation and zero correlation. In this condition, correlation is greater than 0 but less than 1. Limited correLation can be of three types:
→ High : In high degree correlation, the value of correlation coefficient lies in the range of 0.75 and 0.9. When the sign is +. there is high positive correlation and when the sign is -, there is high negative correlation.
→ Moderate : In moderate degree correlation, the value of correlation coefficient lies in the range of 0.5 and 0.75. For instance, the value of correlation coefficient as +0.59 represents moderate positive correlation.
→ Low : In low-degree correlation, the value of correlation coefficient lies in the range of O and 0.5. 1f the value of correlation coefficient is - 0.23 then it represents low negative Correlation.
Question 2.
Write the steps to calculate Karl Pearson’s coefficient of correlation using short-cut method.
Answer:
Short-cut method is preferred to use when arithmetic mean is not a complete number. In this method, deviation is calculated from assumed mean for both the senes. The steps to calculate Karl Pearson’s coefficient of correlation using short-cut method are as below:
(i) Take any value from the middle of the series as assumed mean, A for X-senes and B for Y-series.
(ii) Find the deviation of each value of the scenes from the assumed mean (dx = X - A; dy = Y - B). it can be either positive or negative.
(iii) Find the square of deviations for each series; dx2 and dy2; and add the squares to obtain ∑dx2 and ∑dy2 respectively.
(iv) Find the product of the deviations of two series, dxdy and add them to obtain ∑dxdy.
(v) Calculate Karl Pearson’s coefficient of correlation using the formula:
\(r=\frac{N \sum d x d y-\left(\sum d x\right)\left(\sum d y\right)}{\sqrt{N \Sigma d x^2-\left(\sum d x\right)^2} \sqrt{N \sum d y^2-\left(\sum d y\right)^2}}\)
Question 3.
What are the merits of rank correlation coefficient
Answer:
The merits of rank correlation coefficient are:
(i) It is easier to calculate and understand correlation using this method.
(ii) This method is the most appropriate for the calculation of correlation in case of qualitative and irregular facts.
(iii) This method can be employed for finding correlation even when the actual data is not given. Correlation can be found by simply using the ranks assigned to the values.
Question 4.
Write the demerits of rank correlation coefficient.
Answer:
The demerits of rank correlation coefficient are:
(i) This method is not so definite.
(ii) This method cannot be used when number of items is very high.
(iii) This method is applicable only to individual series and not for frequency distributions.
Question 5.
Write the steps to find Spearrrian rank correlation when ranks are not given to the items of the series.
Answer:
The steps to calculate Spearrnan rank correlation when ranks are not given to the items of the series using short-cut method are as below:
(i) Assign rank I to the lowest (highest) value, rank 2 to the next higher (lower) value and so on.
(ii) Represent the ranks of 1st variable by R1 and that of 2 variable by R2.
(iii) Find the rank difference, D = R1 - R2.
(iv) Find the squares of difference, D2.
(y) Add the squares of rank difference, ∑D2.
(vi) Calculate Spearman’s rank correlation coefficient using the formula
\(r_k=\frac{6 \sum D^2}{N^3-N}\)
Question 6.
Is it possible to find rank correlation when ranks are repeated’ How?
Answer:
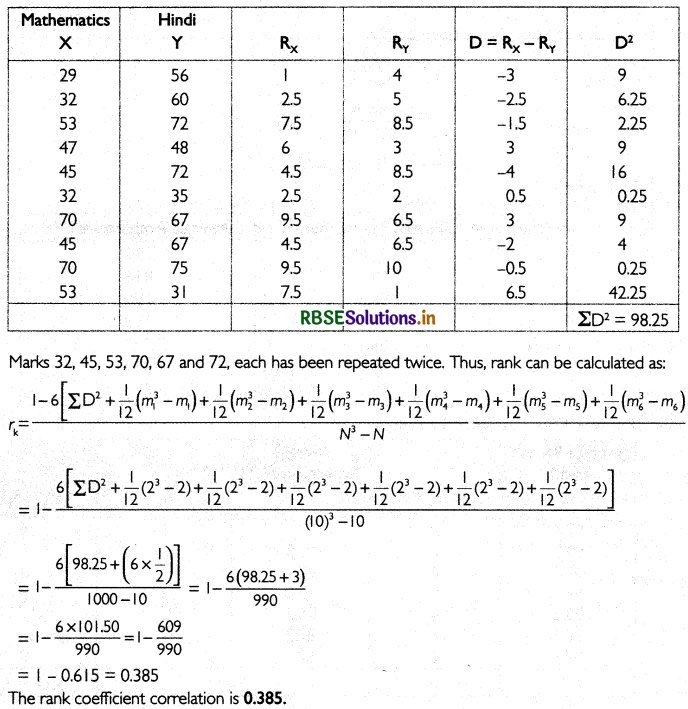
If in any series, the value of two or more items is same then the ranks will also be the same, that is, ranks will be repeated. In this condition, a corrected formula for rank correlation is used. The formula is:
\(r_k=1-\frac{6\left[\sum D^2+\frac{\left(m_1^3-m_1\right)}{12}+\frac{\left(m_2^3-m_2\right)}{12}+\ldots \ldots \ldots\right]}{N^3-N}\)
where; D = Rank difference
m = Number of times a value is repeated
\(\frac{1}{12}\left(m_i^3-m_i\right)\)= Correction factor (It is used as many times as a value is repeated.)
Suppose X series has the value 19, both at the 3rd and 4th rank Thus, both the values are given average rank, that is rank
\(\frac{3+4}{2} \text { th }=3.5^{\text {th }} \text { rank }\)
Numerical Questions
Karl Pearson’s Coefficient of Correlation
Question 1.
Find correlation coefficient:
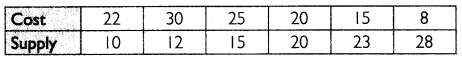
Answer:
The table below shows the calculations required to find correlation coefficient between cost and supply.
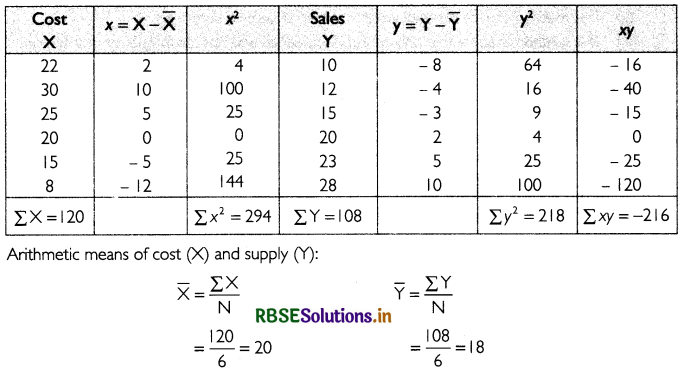
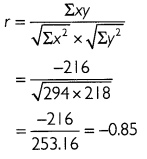
Thus, the correlation coefficient between cost and supply is - 0.85.
Question 2.
Find the correlation between cost and supply.
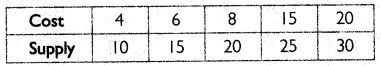
Answer:
Let the assured mean for cost is A = 8.
Let the assured mean for supply is B = 20.
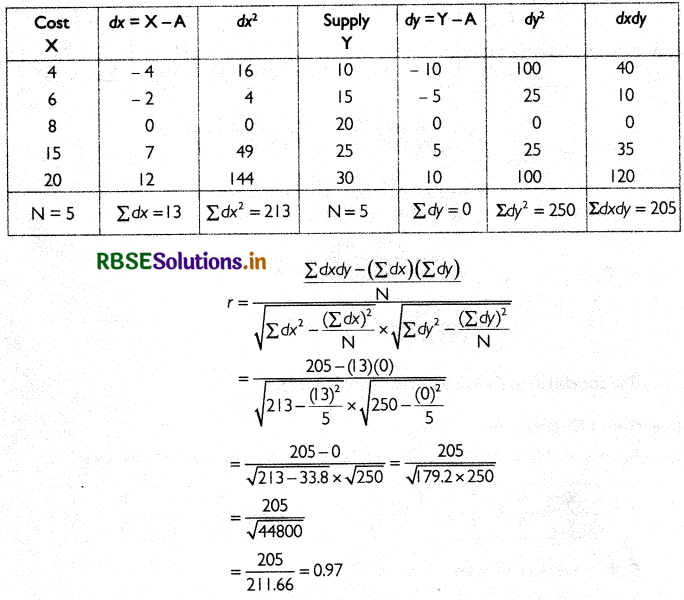
Thus, the correlation coefficient between cost and supply is 0.97.
Question 3.
Calculate correlation by direct method.
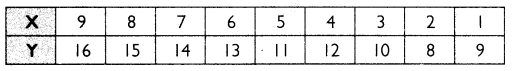
Answer:
The table below shows the calculations required to find correlation coefficient.
The correlation coefficient between X and Y is 0.95.
Spearman’s Correlation
Question 1.
Ranking of 10 students in Hindi and English on the basis of marks obtained are:
Calculate rank cofficient of correlation.
Answer:
The table below shows the calculations to find out rank coefficient
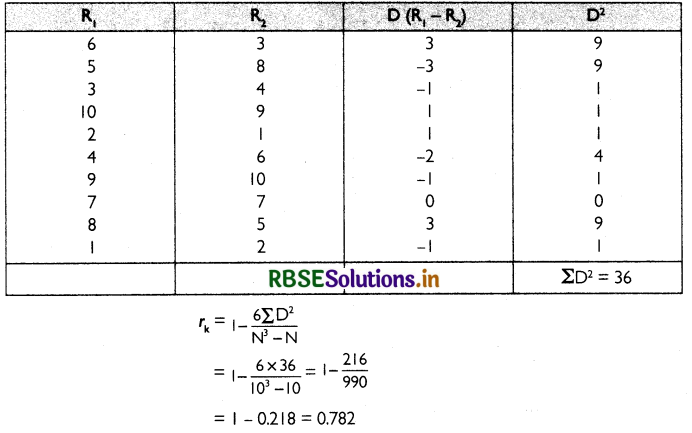
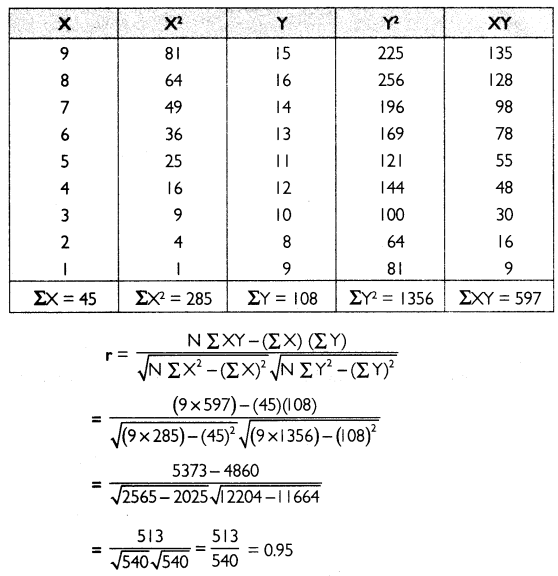
Question 2.
Find correlation.
Answer:
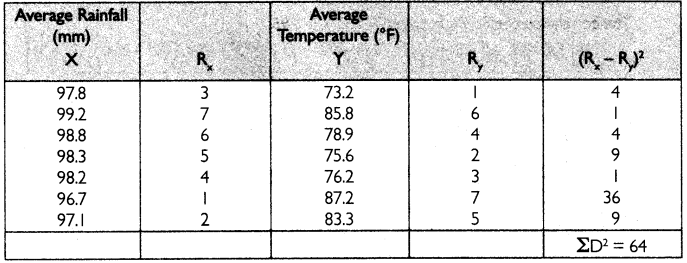
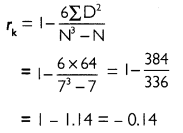
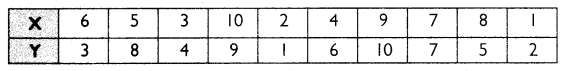
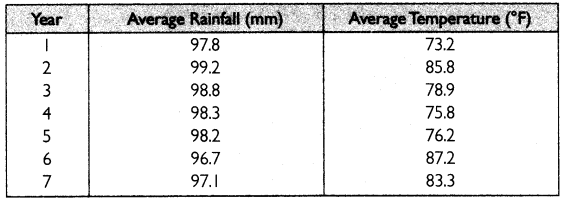
Question 3.
Find rank coefficient of correlation from the following data:

Answer:
The table below calculates the ranks on the basis of marks obtained:
Other Order Thinking Skills
Question 1.
State the difference between linear and non-linear correlation.
Answer:
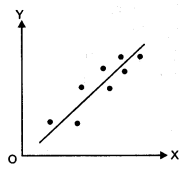
In linear correlation, the ratio of change in two sets of data is constant. All the points on the scatter diagram lie on or near a straight line as shown in the figure.
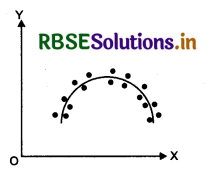
In non-linear correlation, the ratio of change in two sets of data is not constant Ail the points on the scatter diagram lie near a smooth curve as shower in the figure.
Question 2.
State the meaning of Line of Best fit’.
Answer:
Line of best fit is the one that passes through the scattered points such that it represents most of their points. Roughly. half of the scattered points should be on either side of the line,
Objective Type Questions
Choose the correct answer:
Question 1.
Which of the following stages in statistical study uses correlation as a statistical tool?
(A) Data Collection
(B) Data Presentation
(C) Data Analysis
(D) Data Interpretation
Answer:
(C) Data Analysis
Question 2.
What kind of relation exists between variables when increase ¡n one variable causes decrease in the other?
(A) Negative
(B) Positive
(C) linear
(D) Curvilinear
Answer:
(A) Negative
Question 3.
What type of pattern will be formed by a scatter plot showing linear correlation?
(A) U-shaped curve
(B) Straight line
(C) Inverted U-shaped curve
(D) Circle
Answer:
(B) Straight line
Question 4.
How many degrees of correlation are there?
(A) Five
(B) Four
(C) Three
(D) Two
Answer:
(D) Two
Question 5.
What is the range of the value of r?
(A) -l ≤ r ≤ l
(B) 0 ≤ r ≤ l
(C) - I ≤ r ≤ I
(D) - I ≤ r ≤ 2
Answer:
(A) -l ≤ r ≤ l
Question 6.
If Coy (X. Y) = o then
(A) X and Y are positively correlated
(B) X and Y are uncorrelated
(C) X and Y are negatively correlated
(D) X and Y are linearly related
Answer:
(B) X and Y are uncorrelated
Question 7.
If Cov (X,Y) = σx σY then
(A) r = 0
(B) r = \(\frac{1}{2}\)
(C) r = 1
(D) r = 2
Answer:
(C) r = 1
Question 8.
The value of r is not affected by the change of
(A) Origin
(B) Scale
(C) Both (A) and (B)
(D) Neither (A) nor (B)
Answer:
(C) Both (A) and (B)
Question 9.
Who developed rank correlation?
(A) Ronald Fisher
(B) Karl Pearson
(C) W. Edwards
(D) C.E. Spearrnan
Answer:
(D) C.E. Spearrnan
Question 10.
What is does D2 in the rank correlation formula?
(A) Square of difference
(B) Square of sum
(C) Square of product
(D) Square of ratio
Answer:
(A) Square of difference
I. Fill in the blanks with correct answer.
1. The value of correlation coefficient is free from _____ .
2. _____ is the one that passes through the scattered points such that it represents most of their points.
3. ____ is the graphical representation of correlation.
4. The nature of correlation for height of a person and marks obtained in English test is_____
5. When r lies between +0.5 and O then there is low degree _____ correlation.
6. When ail the points lie on the line in the downward direction, there is ______negative correlation between X and Y.
7. The value of r is ______ by the change of origin and change of scale.
8. ___ are the variables which cannot be measured numerically.
9. Rank correlation is useful to study _______________ attributes.
10. The value of r is ______ or equal to the value of r.
Answer:
1. units
2. Line of best fit
3. Scatter diagram
4. Zero
5. Positive
6. perfect
7. not affected
8. Attributes
9. qualitative
10. less than
II. State whether the following statements are true or false.
1. Con-elation does not imply causation.
2. The coefficient of correlation can never be negative.
3. In low linear correlation, points lie on or near the line of best fit.
4. The value of r indicates high linear relation when it is close to ÷ I or - I.
5. Both correlation coefficient (r) and covariance are measures of linear association.
6. If r = 0, the Cov (X. Y) is also 0.
7. Karl Pearsons coefficient of correlation cannot be used for all types of relationships.
8. Accurate measurement is difficult for qualitative aspects.
9. Rank correlation coefficient is given by \(r_k=1-\frac{6 \sum D^2}{N^3-N}\)
10. The interpretations of rank correlation coefficient and simple correlation coefficient are different.
Answers:
1. True
2. False
3. False
4. True
5. True
6. True
7. False
8. True
9. True
10. False
III. Match the following.
|
Column - I |
Column - II |
|
1. Correlation |
(A) Variables change in the same direction |
Answers:
1. (D) 2. (A) 3. (B) 4. (C) 5. (F) 6. (E) 7. (H) 8. (G) 9. (J) 10. (l)
IV. Read the following statement- Assertion (A) and Reason (R). Choose one of the correct alternatives given below:
Assertion (A): Karl Pearson’s coefficient of correlation gives the numerical value of the degree of
correlation between two variables.
Reason (R): Karl Pearson has given a quantitative method of calculating correlation. Ahematives:
(a) Both Assertion (A) and Reason (R) are true and Reason (R) is the correct explanation of Assertion (A).
(b) Both Assertion (A) and Reason (R) are true and Reason (R) is not the correct explanation of Assertion (A).
(c) Assertion (A) is true and Reason (R) is false.
(d) Assertion (A) is false and Reason (R) is true.
Answer:
(b) Both Assertion (A) and Reason (R) are true and Reason (R) is not the correct explanation of Assertion (A).
V. Read the following hypothetical case study, carefully and answer the following questions on the base of the same:
Correlation studies and measures the direction and intensity of relationships among variables Correlation measures covanation, not causation. Correlation should never be interpreted as implying cause and effect relation. The presence of correlation between two variables X and Y simply means that when the value of one variable is found to change in one direction, the value of the other variable is found to change either in the same &ection or in the opposite direction, but in a definite way. For simplicity, we assume here that the correlation, if it exists, is linear. i.e. the relative movement of the two variables can be represented by drawing a straight line on graph paper.
1. ________ measures the relationship between two or more variables (Correlation/Range)
2. At the value of r -1 then there is a perfect - correlation between X and Y. (positive/negative)
3. In ___________ correlation, two varia6les move in same direction. (positive/negative)
4. Correlation in denoted by _________ (r/c)
Answers:
1. Correlation
2. negative
3. positive
4. r

- RBSE Class 11 Economics Important Questions Chapter 9 पर्यावरण और धारणीय विकास
- RBSE Class 11 Economics Important Questions Chapter 3 Organisation of Data
- RBSE Class 11 Economics Important Questions Chapter 2 Collection of Data
- RBSE Class 11 Economics Important Questions Chapter 4 Presentation of Data
- RBSE Class 11 Economics Important Questions Chapter 1 Introduction to Statistics for Economics
- RBSE Class 11 Economics Important Questions Chapter 6 Measures of Dispersion
- RBSE Class 11 Economics Important Questions in Hindi & English Medium
- RBSE Class 11 Economics Important Questions Chapter 8 Index Numbers
- RBSE Solutions for Class 11 Economics in Hindi Medium & English Medium
- RBSE Class 11 Economics Important Questions Chapter 5 Measures of Central Tendency
- RBSE Solutions for Class 11 Economics Chapter 7 Correlation