RBSE Solutions for Class 11 Economics Chapter 3 Organisation of Data
Rajasthan Board RBSE Solutions for Class 11 Economics Chapter 3 Organisation of Data Textbook Exercise Questions and Answers.
Rajasthan Board RBSE Solutions for Class 11 Economics in Hindi Medium & English Medium are part of RBSE Solutions for Class 11. Students can also read RBSE Class 11 Economics Important Questions for exam preparation. Students can also go through RBSE Class 11 Economics Notes to understand and remember the concepts easily.
RBSE Class 11 Economics Solutions Chapter 3 Organisation of Data
RBSE Class 11 Economics Organisation of Data Textbook Questions and Answers
Question 1.
Which of the following alternatives is true?
(i) The class midpoint is equal to:
(a) the average of the upper class limit and the lower class limit
(b) the product of upper class limit and the lower class limit
(c) the ratio of the upper class limit and the lower class limit
(d) None of the above
Answer:
(a) The class midpoint is equal to the average of the upper class limit and the lower class limit.

(ii) The frequency distribution of two variables is known as:
(a) Univariate Distribution
(b) Bivariate Distribution
(c) Multivariate Distribution
(d) None of the above
Answer:
(b) The frequency distribution of two variables is known as Bivariate Distribution.
(iii) Statistical calculations in classified data are based on:
(a) the actual values of observations
(b) the upper class limits
(c) the lower class limits
(d) the class mid-points
Answer:
(d) Statistical calculations in classified data are based on the class mid-points.
(iv) Under Exclusive method
(a) the upper class limit of a class is excluded in the class interval
(b) the upper class limit of a class is included in the class interval
(c) the lower class limit of a class is excluded in the class interval
(d) the lower class limit of a class is included in the class interval
Answer:
(a) Under Exclusive method, the upper class limit of a class is excluded in the class interval.
(v) Range is the .............
(a) difference between the largest and the smallest observations
(b) difference between the smallest and the largest observations
(c) average of the largest and the smallest observations
(d) ratio of the largest to the smallest observation.
Answer:
(a) Range is the difference between the largest and the smallest observations.
Question 2.
Can there be any advantage in classifying things? Explain with an example from your daily life.
Answer:
Classification of data is the process of organising the raw data into groups or classes to facilitate further statistical analysis. Classification enables to locate facts easily, make comparison, and draw conclusions without any difficulty. For example, in school library, books are arranged according to subjects and then in alphabetical order.
Question 3.
What is a variable? Distinguish between a discrete and a continuous variable.
Answer:
Variables are those facts which can be presented in numeric form and may assume more than one set of values. The variables are generally represented by the letters x, y, z. The values of these variables are the observation.
The following are the points of difference between a discrete and a continuous variable:
|
S.No |
Discrete Variable |
Continuous Variable |
|
1 |
A discrete variable can take only certain values. |
A continuous variable can take any numerical value. |
|
2 |
Its value changes only by finite ‘jumps' from one value to another but does not take any intermediate value between them |
Continuous variable may take integral values, fractional values and values that are not exact fractions. |
|
3 |
Example: Numbers of members in a family could be 1,5 or 7 but not 1.5,2.5, or 5.5. |
Example: height of human being can be expressed as 6’ 11", 57", 6*8" etc. |
Question 4.
Explain the ‘exclusive’ and ‘inclusive’ methods used in classification of data.
Answer:
In exclusive method of classification of data, classes are formed in such a way that the lower limit of a class coincides with the upper class limit of the previous class. Thus, an observation which is exactly equal to the upper class limit would not be included in that class but in the next class. On the other hand, if it was equal to the lower class limit then it would be included in that class. For example, in the class intervals of 20-30 and 30-40, the number 30 will be included in the class interval of 30-40 but not in the class interval of 20-30.
Inclusive method does not exclude the upper class limit in a class interval and hence, both class limits are parts of the class interval. For example, in the frequency distribution of 200-299, 300-399, 400-499 class, we include those employees in the class 300-399 whose income is either 300 or between 300 and 399. If the income is exactly 400 then he will be put in the next class.
Question 5.
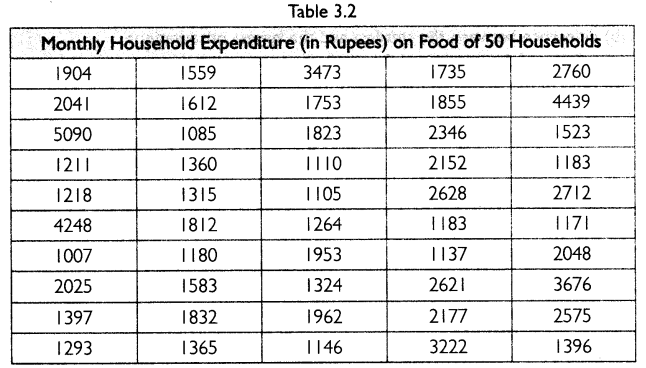
Use the data in Table 3.2 that relate to monthly household expenditure (in ₹) on food of 50 households and
(i) Obtain the range of monthly household expenditure on food.
(ii) Divide the range into appropriate number of class intervals and obtain the frequency distribution of expenditure.
(iii) Find the number of households whose monthly expenditure on food is:
(a) Less than 2,000
(b) More than 3,000
(c) Between 1,500 and 2,500
Answer:
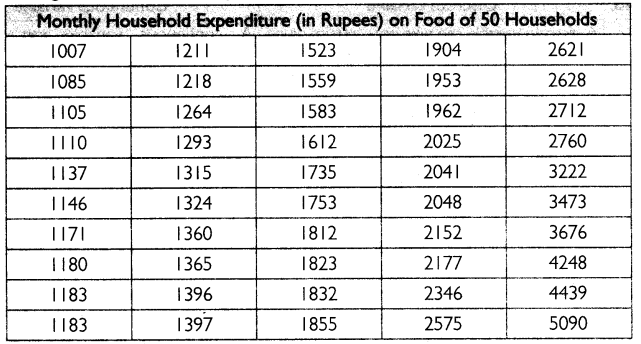
First, arrange the data in ascending order as shown in the table below:
(i) Range is the difference between the largest and the smallest value of a variable.
Largest Value = 5090 Smallest Value = 1007
Thus, the range of monthly household expenditure on food can be calculated as:
Range =5090-1007
= ₹ 4083
(ii) By dividing the range into appropriate number of class intervals, we can obtain the following frequency distribution of expenditure:
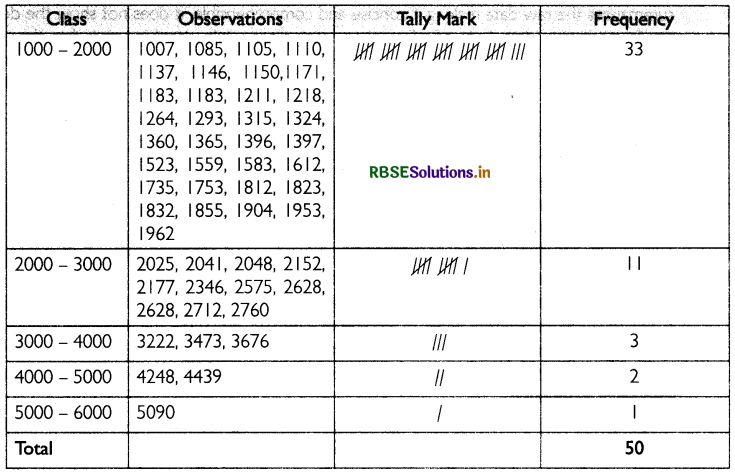
(iii) The number of households whose monthly expenditure on food is:
(a) Less than ₹ 2,000 = 33
(b) More than ₹ 3,000 = 6
(c) Between ₹ 1,500 and ₹ 2,500 = 19
Question 6.
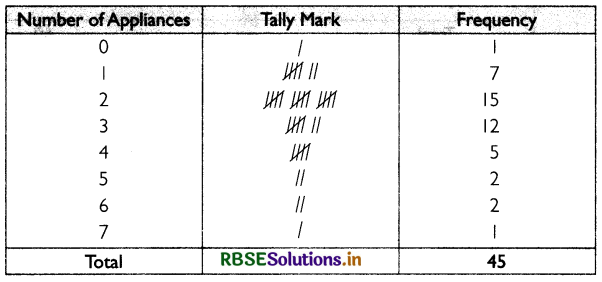
In a city 45 families were surveyed for the number of domestic appliances they used. Prepare a frequency array based on their replies as recorded below.
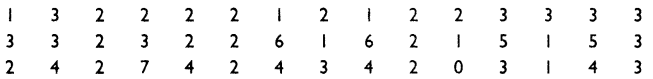
Answer:
A frequency array based on the survey of 45 families for the number of domestic appliances they used is given below:
Question 7.
What is ‘loss of information in classified data?
Answer:
The classification of data in the form of frequency distribution has an inherent shortcoming. While it summarises the raw data making it concise and comprehensible, it does not show the details which are found in raw data. Loss of information takes place while classifying raw data though much is gained by summarising it as classified data. Once the data are grouped into classes, an individual observation has no significance in further statistical calculations. Thus, the use of class marks instead of the actual values of the observations in statistical methods involves considerable loss of information.
Question 8.
Do you agree that classified data is better than raw data?
Answer:
Raw data are highly disorganised. They are often very large and cumbersome to handle. Drawing meaningful conclusions from them is a tedious task, On the other hand, classified data bring order to raw data. The raw data are summarised and made comprehensible by dassificatìon. When facts of similar characteristics are placed ¡n the same class, it enables one to locate them easily make instead of the actual values of the observations in statistical methods involve considerable loss of information.
Question 9.
Distinguish between univariate and bivariate frequency distribution.
Answer:
The frequency distribution of a single variable is called a univariate frequency distribution. For example, marks of students, different levels of income of a person, etc. show the univariate distribution.The frequency distribution of two variables is called a bivariate frequency distribution.
For example, sales and expenditure, price and quantity demanded, price and supply, etc. show the bivanate frequency distribution.
Question 10.
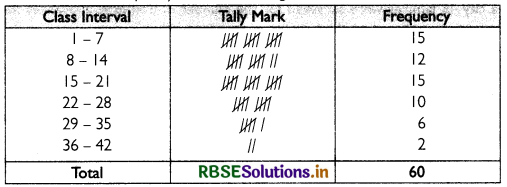
Prepare a frequency distribution by inclusive method taking class interval of 7 from the following data.
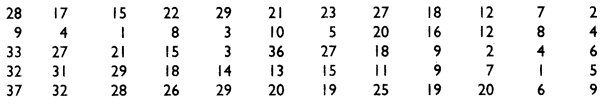
Answer:
The table below shows the frequency distribution using inclusive method:

- RBSE Class 11 Economics Important Questions Chapter 9 पर्यावरण और धारणीय विकास
- RBSE Class 11 Economics Important Questions Chapter 3 Organisation of Data
- RBSE Class 11 Economics Important Questions Chapter 2 Collection of Data
- RBSE Class 11 Economics Important Questions Chapter 4 Presentation of Data
- RBSE Class 11 Economics Important Questions Chapter 1 Introduction to Statistics for Economics
- RBSE Class 11 Economics Important Questions Chapter 6 Measures of Dispersion
- RBSE Class 11 Economics Important Questions in Hindi & English Medium
- RBSE Class 11 Economics Important Questions Chapter 8 Index Numbers
- RBSE Class 11 Economics Important Questions Chapter 7 Correlation
- RBSE Solutions for Class 11 Economics in Hindi Medium & English Medium
- RBSE Class 11 Economics Important Questions Chapter 5 Measures of Central Tendency