RBSE Class 11 Economics Notes Chapter 7 Correlation
These comprehensive RBSE Class 11 Economics Notes Chapter 7 Correlation will give a brief overview of all the concepts.
Rajasthan Board RBSE Solutions for Class 11 Economics in Hindi Medium & English Medium are part of RBSE Solutions for Class 11. Students can also read RBSE Class 11 Economics Important Questions for exam preparation. Students can also go through RBSE Class 11 Economics Notes to understand and remember the concepts easily.
RBSE Class 11 Economics Chapter 7 Notes Correlation
Correlation and its Types:
Correlation is a statistical measure that shows the degree to which two or more variables fluctuate in relation to one another, Correlation does not imply causation.
Techniques of Measuring Correlation
- Scatter diagram
- Karl Pearson’s Coefficient of Correlation
- Spearman’s Rank Correlation
Types of Correlation
- Positive correlation - variables move in same direction
- Negative correlation - variables move in opposite direction
- Linear correlation - represented by straight line
- Non-linear correlation - represented by a smooth curve

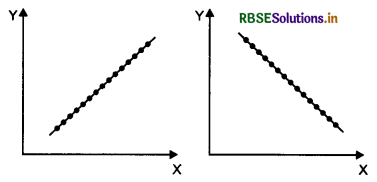
Scatter Diagram:
Scatter diagram graphically shows the direction and degree of correlation between variables. Relationship between Variables
(i) Perfect correlation - all the points lie on a line
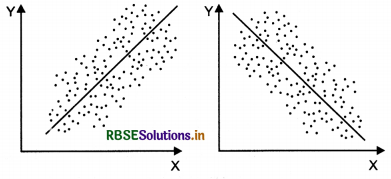
(ii) Low linear correlation - points are widely dispersed around the line
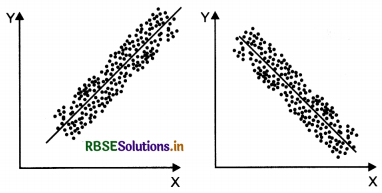
(iii) High linear correlation - points lie near a line or on a line
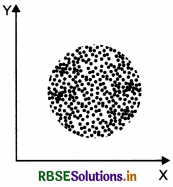
(iv) No correlation - points do not follow any pattern
Kari Pearson’s Coefficient of Correlation:
- Karl Pearson’s coefficient of correlation gives the numerical value of the degree of correlation between two variables.
- Karl Pearson has given a quantitative method of calculating correlation.
- Karl Pearson’s measure of correlation (r) is given by:
r = \(\frac{\sum x y}{N \sigma_x \sigma_y}\)
where; x = X - X̄ and y = Y - Ȳ - The value of r lies between -1 and +1, that is, -1 ≤ r ≤ +1.
Type of Correlation for Different Values of r
- r = 0 No Correlation
- r = +1 Perfect Positive Correlation
- r = -1 Perfect Negative Correlation
The value of r indicates high linear relation when it is close to +1 or -1 while it indicates a weak relation when close to zero.
Formula to calculate Karl Pearson’s coefficient of correlation for continuous series:
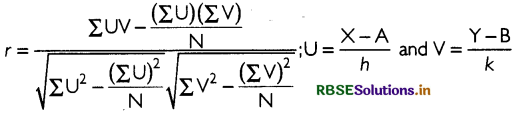
where; A and B are assumed means, h and k are common factors for variable X and Y respectively.
Spearman’s Rank Correlation
- Spearman’s rank correlation measures the linear relation between ranks assigned to individual items according to their attributes.
- It was developed by British psychologist C.E. Spearman.
- Attributes are the variables that cannot be measured numerically.
Spearman’s rank correlation (rk) is given by:
rk = l - \(\frac{6 \sum D^2}{N^3-N}\)
When the ranks are repeated, Spearman’s rank correlation (rk) is given by:
rk = l - \(\frac{6\left[\sum D^2+\frac{\left(m_1^3-m_1\right)}{12}+\frac{\left(m_2^3-m_2\right)}{12}+\ldots\right]}{N^3-N}\)
where; m1, m2, ........... are the number of repetitions of ranks.
The value of rk lies between -1 and +1, that is, -1 ≤ rk ≤ +1.

- RBSE Class 11 Economics Important Questions Chapter 9 पर्यावरण और धारणीय विकास
- RBSE Class 11 Economics Important Questions Chapter 3 Organisation of Data
- RBSE Class 11 Economics Important Questions Chapter 2 Collection of Data
- RBSE Class 11 Economics Important Questions Chapter 4 Presentation of Data
- RBSE Class 11 Economics Important Questions Chapter 1 Introduction to Statistics for Economics
- RBSE Class 11 Economics Important Questions Chapter 6 Measures of Dispersion
- RBSE Class 11 Economics Important Questions in Hindi & English Medium
- RBSE Class 11 Economics Important Questions Chapter 8 Index Numbers
- RBSE Class 11 Economics Important Questions Chapter 7 Correlation
- RBSE Solutions for Class 11 Economics in Hindi Medium & English Medium
- RBSE Class 11 Economics Important Questions Chapter 5 Measures of Central Tendency