RBSE Class 11 Economics Notes Chapter 7 Correlation
These comprehensive RBSE Class 11 Economics Notes Chapter 7 Correlation will give a brief overview of all the concepts.
RBSE Class 11 Economics Chapter 7 Notes Correlation
Correlation and its Types:
Correlation is a statistical measure that shows the degree to which two or more variables fluctuate in relation to one another, Correlation does not imply causation.
Techniques of Measuring Correlation
- Scatter diagram
- Karl Pearson’s Coefficient of Correlation
- Spearman’s Rank Correlation
Types of Correlation
- Positive correlation - variables move in same direction
- Negative correlation - variables move in opposite direction
- Linear correlation - represented by straight line
- Non-linear correlation - represented by a smooth curve

Scatter Diagram:
Scatter diagram graphically shows the direction and degree of correlation between variables. Relationship between Variables
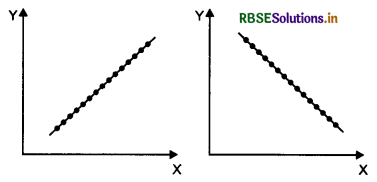
(i) Perfect correlation - all the points lie on a line
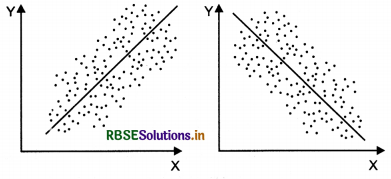
(ii) Low linear correlation - points are widely dispersed around the line
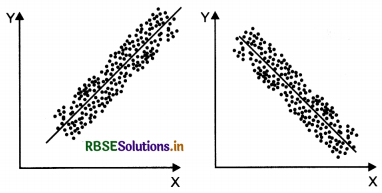
(iii) High linear correlation - points lie near a line or on a line
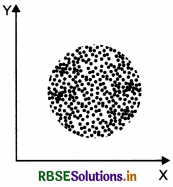
(iv) No correlation - points do not follow any pattern
Kari Pearson’s Coefficient of Correlation:
- Karl Pearson’s coefficient of correlation gives the numerical value of the degree of correlation between two variables.
- Karl Pearson has given a quantitative method of calculating correlation.
- Karl Pearson’s measure of correlation (r) is given by:
r = \(\frac{\sum x y}{N \sigma_x \sigma_y}\)
where; x = X - X̄ and y = Y - Ȳ - The value of r lies between -1 and +1, that is, -1 ≤ r ≤ +1.
Type of Correlation for Different Values of r
- r = 0 No Correlation
- r = +1 Perfect Positive Correlation
- r = -1 Perfect Negative Correlation
The value of r indicates high linear relation when it is close to +1 or -1 while it indicates a weak relation when close to zero.
Formula to calculate Karl Pearson’s coefficient of correlation for continuous series:
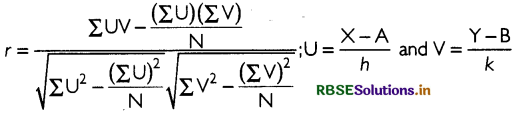
where; A and B are assumed means, h and k are common factors for variable X and Y respectively.
Spearman’s Rank Correlation
- Spearman’s rank correlation measures the linear relation between ranks assigned to individual items according to their attributes.
- It was developed by British psychologist C.E. Spearman.
- Attributes are the variables that cannot be measured numerically.
Spearman’s rank correlation (rk) is given by:
rk = l - \(\frac{6 \sum D^2}{N^3-N}\)
When the ranks are repeated, Spearman’s rank correlation (rk) is given by:
rk = l - \(\frac{6\left[\sum D^2+\frac{\left(m_1^3-m_1\right)}{12}+\frac{\left(m_2^3-m_2\right)}{12}+\ldots\right]}{N^3-N}\)
where; m1, m2, ........... are the number of repetitions of ranks.
The value of rk lies between -1 and +1, that is, -1 ≤ rk ≤ +1.
