RBSE Class 11 Economics Important Questions Chapter 6 Measures of Dispersion
Rajasthan Board RBSE Class 11 Economics Important Questions Chapter 6 Measures of Dispersion Important Questions and Answers.
Rajasthan Board RBSE Solutions for Class 11 Economics in Hindi Medium & English Medium are part of RBSE Solutions for Class 11. Students can also read RBSE Class 11 Economics Important Questions for exam preparation. Students can also go through RBSE Class 11 Economics Notes to understand and remember the concepts easily.
RBSE Class 11 Economics Important Questions Chapter 6 Measures of Dispersion
Very Short Answer Type Questions
Question 1.
Define dispersion.
Answer:
Dispersion is the extent to which values in a distribution vary from the average of the distribution.
Question 2.
Name the two types of measures.
Answer:
Measures of dispersion can be classified as absolute measures and relative measures.
Question 3.
Define absolute measures of dispersion.
Answer:
Absolute measures of dispersion are expressed in terms of original units of a data.

Question 4.
List the methods of absolute measures of dispersion.
Answer:
The methods of absolute measures of dispersion are:
(i) Range
(ii) Quartile deviation
(iii) Mean deviation
(iv) Standard deviation
Question 5.
What are relative measures of dispersion?
Answer:
Relative measures of dispersion are expressed in terms of percentage and ratios. Coefficient of; range, coefficient of quartile deviation, coefficient of mean deviation and coefficient of variance are the relative measures of dispersion.
Question 6.
Why is it important to know the spread of values?
Answer:
The averages tell only one aspect of a distribution, that is, a representative size of the values. It important to know the spread of values to understand averages in a better manner.
Question 7.
Define range.
Answer:
Range is the difference between the highest value and the lowest value in a series.

Question 8.
Give the formula for finding range.
Answer:
The formula for finding range (R) is:
R = H - L
where; H = Highest value in a series
L = Lowest value in a series
Question 9.
What is the coefficient of range?
Answer:
Coefficient of range is the ratio of the difference between the highest and lowest values of the series to the sum of the lowest and highest values of the series.
Question 10.
How is coefficient of range calculated?
Answer:
Coeffident of range is calculated by using the formula
\(\frac{H-L}{H+L} .\)
Question 11.
Define inter-quartile range.
Answer:
Inter-quartile range is the difference between the third (Q3) and first (Q1) quartile of a series.

Question 12.
What is quartile deviation?
Answer:
Quartile deviation is the half of the inter-quartile range, that is:
Quartile Deviation \(=\frac{Q_3-Q_1}{2}\)
Question 13.
Give the formula for calculating coefficient of quartile deviation.
Answer:
Coefficient of quartile deviation can be calculated as:
Coefficient of Q.D. \(=\frac{Q_3-Q_1}{Q_3+Q_1}\)
Question 14.
Why is inter-quartile range not affected by extreme value
Answer:
Inter-quartile range is not affected by extreme values because it is based on the middle 50 per cit of the values.
Question 15.
Define mean deviation.
Answer:
Mean deviation is the arithmetic average of the deviations of all the values taken from average value (mean or median) of the senes.
Question 16.
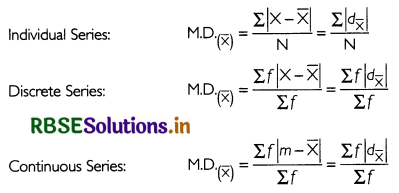
Write the formula of mean deviation from mean.
Answer:
Formulae for calculating mean deviation from mean are as below

Question 17.
Why is mode not used to calculate mean deviation
Answer:
Mode is not used to calculate mean deviation because it is not a stable average.
Question 18.
What is the formula for calculate coeffient of mean deviation from mean?
Answer:
The formula for calculating coefficient of mean deviation from mean is:
\(\text { Coefficient of M.D.(Me) }=\frac{M_{. D \cdot(M e)}}{M e}\)
Question 19.
Define standard deviation.
Answer:
Standard deviation (σ) is the square root of the arithmetic mean of the squares of all deviations.
Question 20.
Define variance.
Answer:
Variance is the square of the standard deviation.
Question 21.
What is coefficient of variation
Answer:
Coefficient of variation is the percentage variation in the mean. It can be calculated as:
\(C . V_{.}=\frac{\sigma}{\bar{X}} \times 100\)
Question 22.
Name the average on the basis of which standard deviation is calculated.
Answer:
Standard deviation is calculated on the basis of the mean.

Question 23
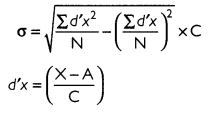
Give the formula for calculating standard deviation for continuous series.
Answer:
The formula for calculating standard deviation for continuous series is:
Question 24.
What is Lorenz curve
Answer:
Lorenz curve is the graphica] representation of dispersion. ft compares the variability of two or more distribution.

Question 25.
What does Lorenz curve indicate?
Answer:
Lorenz curve indicates the degree of variability through the information expressed in a cumulative form.
Question 26.
How does Lorenz cutie analyse dispersion?
Answer:
When there are two or more curves, the one which is the farthest from line of equal distribution has the highest dispersion.
Short Answer Type Questions
Question 1.
Discuss the features of a good measure of dispersion?
Answer:
The following are the features of a good measure of dispersion:
(i) It should be simple to understand and easy to calculate.
(ii) It should be rigidly defined.
(iii) It should be based upon all values of the given distribution.
(iv) It should be capable of advanced mathematical treatment
(v) It should have sampling stability.
(vi) It should be not be unduly affected by extreme values.
Question 2.
Distinguish between absolute and relative measures of dispersion.
Answer:
Following are the points of difference between absolute and relative measures of dispersion:
|
Absolute Measures of Dispersion |
Relative Measures of Dispersion |
|
Absolute measures of dispersion are expressed in terms of original units of data. |
Relative measures of dispersion are expressed in terms of percentages and ratios. |
|
The methods of absolute measures of dispersion are:
|
The methods of relative measures of dispersion are coefficient of:
|
Question 3.
State the limitations of absolute measures of dispersion.
Answer:
Following are the limitations of absolute measures of dispersion:
(i) Absolute measures may give misleading ideas about the degree of variation.
(ii) They give answer in the units in which original values are expressed thereby making them inappropriate for comparison.

Question 4.
What are the objectives of measuring dispersion?
Answer:
The objectives of measuring dispersion are:
(i) To determine the reliability of the average
(ii) To compare the variability of two or more distributions
(iii) To facilitate the use of other statistical methods
(iv) To know the nature and hence, control the reasons of variation
Question 5.
State the merits of range.
Answer:
Following are the merits of range:
(i) It is easy to understand and calculate.
(ii) It is widely used
(iii) Its calculation takes lesser time.
Question 6.
What are the limitation of the range?
Answer:
Following are the limitations of range:
(i) Range is unduly affected by extreme values.
(ii) It does not include all the values of the distribution.
(iii) It is not affected by the variation in the mid-values of the series.
(iv) It cannot be calculated for open-ended frequency distribution.
Question 7.
How does the calculation of range differ for a discrete series and a continuous series?
Answer:
In a discrete series, range is the difference between the highest value and the lowest value in a series. For a continuous series, on the other hand, range is calculated as the difference between the upper limit of the highest class and the lower limit of the lowest class.
Question 8.
What are the advantages of quartile deviation as a measure of dispersion
Answer:
Following are the merits of quartile deviation:
(i) It is very simple to calculate and understand.
(ii) Quartile deviation is not affected by extreme values of the senes.
(iii) It can be calculated for open-ended frequency distribution.

Question 9.
State the demerits of quartile deviation.
Answer:
Following are the demerits of quartile deviation:
(i) It is not based on all the values of the senes.
(ii) It is not suitable for further algebraic testing.
(iii) It is affected by fluctuations in sample.
Question 10.
How would you calculate Q1 and Q3 for a discrete series’ What about continuous series
Answer:
In a discrete senes, Q1 and Q3 is the size of \(\frac{N+I}{4} \text { th }\)item and \(\frac{3(N+1)}{4} \text { th }\)item respectively.
For a continuous senes, however Q1 and Q3 is the size of \(\frac{N}{4} \text { th }\)item and \(\frac{3N}{4} \text { th }\)item respectively.
Question 11.
What are the merits and demertts of mean
Answer:
Merits of Mean Deviation
(i) It is simple to calculate and easy to understand.
(ii) Mean deviation is not affected by extreme values.
(iii) Is based on ail the items of the senes and hence, is more representative than range or quartile deviation.
Demerits of Mean Deviation
(i) Mean deviation is not capable of any further mathematical treatment
(ii) Mean deviation suffers from inaccurate results as it ignores algebraic sign in calculation.
Question 12.
Write the steps for calculating mean deviation for discrete series.
Answer:
Following are the steps for calculating mean deviation for discrete senes:
(i) Find the average of the series (mean or median).
(ii) Take the deviations of all the values in the senes from the average calculated in step (i) as |d|
Ignore algebraic signs, plus (+) or minus (-)
(iii) Multiply each deviation by the respective frequency to obtain |d|
(iv) Add the product to obtain ∑f|d|.
(v) Find the sum of the frequencies as ∑f
(vi) Divide ∑f|d| by ∑f to get mean deviation.
According to formula:


Question 13.
Write the merits and demerits of standard deviation. :
Answer:
Merits of Standard Deviation:
(i) It is based on all the value of series.
(ii) It is least affected by the changes in the sample.
(iii) It is a clear and definite measure of dispersion.
(iv) It is capable of further mathematical treatment
Demerits of Standard Deviation:
(i) It is a very lengthy and difficult process.
(ii) Since it is calculated with the help of mean, it is affected by extreme values.
Question 14.
State the important properties of standard deviation.
Answer:
The following are the important properties of standard deviation:
(i) Standard deviation is independent of origin, that is. it is not affected by the constant from which deviations are taken.
(ii) Standard deviation is not independent of scale. that is, if the deviations are divided by a common factor, its value is used in the formula to get the obtain standard deviation.
Question 15.
Explain the steps for calculating standard deviation for individual series.
Answer:
There are two methods for calculating standard deviation for individual senes:
(i) Direct method
(ii) Short-cut method
(i) Steps under Direct Method
- Find arithmetic mean of the series.
- Find the deviation of all the values from mean, x = X - \(\bar{X}\)
- Find square of deviation as x2
- Add them to obtain ∑x
- Divide the sum of squares of deviation the number of observations,
- Take the root of the result to obtain standard deviation.
According to formulae
\(\sigma=\sqrt{\frac{\sum(x-\bar{X})^2}{N}}=\sqrt{\frac{\sum x^2}{N}}\)
(ii) Steps under Short-cut Method
- Assume any value in the series as mean, A.
- Find the deviation of all the values from assumed mean, dx = X - A.
- Obtain the sum of all the deviations, ∑dx.
- Find square of deviation as dx2.
- Add them to obtain ∑dx2.
Apply the following formula:
\(\sigma=\sqrt{\frac{\sum d x^2}{N}-\left(\frac{\sum d x}{N}\right)^2}\)
Question 16.
Write the steps for calculating standard deviation for continuous series.
Answer:
Following are the steps for calculating standard deviation for continuous senes:
(i) Assume any value in the senes as mean, A.
(ii) Find the deviation of all the values from assumed mean, dx = X - A.
(iii) Divide each deviation by common factor, C to obtain dx’.
(iv) Obtain the sum of all the deviations, ∑dx'.
(v) Find square of deviation as dx'2
(vi) Add them to obtain ∑dx'2.
(vii) Apply the following formula: \(\sigma=\sqrt{\frac{\sum d^{\prime} x^2}{N}-\left(\frac{\sum d^{\prime} x}{N}\right)^2} \times C\)

Question 17.
Write the steps for constructing Lorenz curve.
Answer:
Following are the steps for constructing Lorenz curve:
(i) Calculate the mid-value of each class and find their cumulative totals.
(ii) Calculate cumulative frequencies.
(iii) Convert the cumulative totals and cumulative frequencies into percentages.
(iv) On a graph paper, plot cumulative percentages of the total on y-axis and cumulative percentages of frequencies on
y-axis. Each axis will have values from 0 to 100.
(v) Join the co-ordinate (0,0) with (100,100) by drawing a straight line. This line is called the line of equal distribution.
(vi) Plot the cumulative percentages of the total corresponding to respective "cumulative percentages of frequencies.
(vii) Join these points to get the Lorenz curve.
Question 18.
Discuss the application of Lorenz curve.
Answer:
Lorenz curve is a graphical method of studying dispersion. The main aim of constructing a Lorenz curve is to study the degree of inequality in two or more distributions. It was mainly introduced to study the distribution of wealth and income. However, it became popular to study the variability in the distribution of profits, wages, revenue, population, etc.
Numerical Questions
Range and its Coefficient
Question 1.
In a factory. the wages of worker are as follows:
100, 110, 130, 140, 250, 275, 300, 350, 390, 410, 450, 465, 500, 550
Calculate range and coefficient of range.
Answer:
Highest value of the share; H = 550
Lowest value of the share; L = 100
Range H - L
= 550 - 100 = ₹450
Coefficient of Range
\(\begin{aligned} &=\frac{H-L}{H+L}=\frac{550-100}{550+100} \\ &=\frac{450}{650}=0.69 \end{aligned}\)

Question 2.
Find the range and coefficient of range for the following data:

Answer:
The given senes is an inclusive senes. Thus, it needs to be converted into exclusive senes first as shown below:

Upper limit of the highest class; H = 79.5
Lower limit of the lowest class; L = 29.5
Range = H - L
= 79.5 - 29.5 = 50
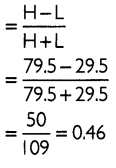
Coefficient of Range =
Quartile Deviation and its Coefficient
Question 1.
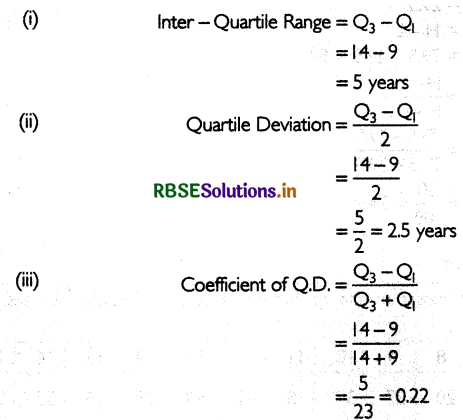
Find inter-quartiIe range, quartile deviation and coeffìcient of quartile deviation for the data given below

Answer:
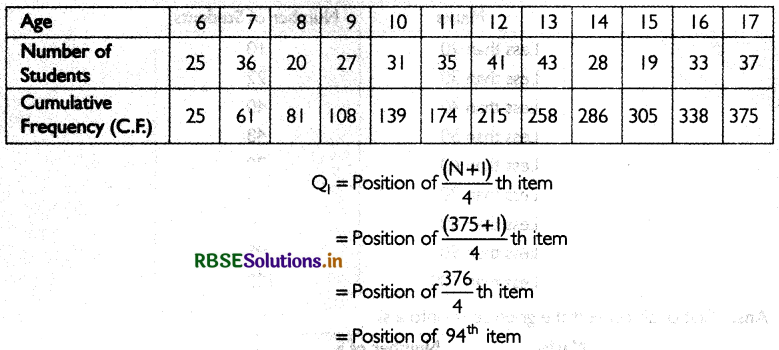
The 94th item has in the cumulative frequency of 108. The age corresponding to this is 9 years. Thus, Q1= 9.
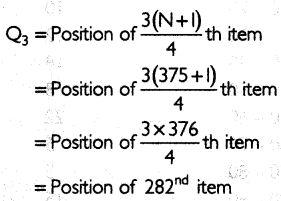
The 282nd item lies in the cumulative frequency of 286. The age corresponding to this is 14 years. Thus Q3= 14.

Question 2.
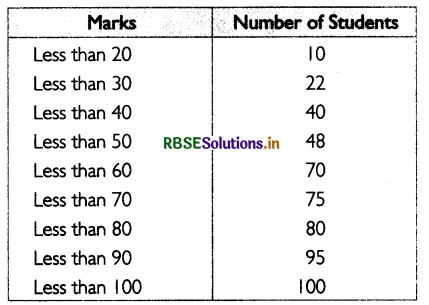
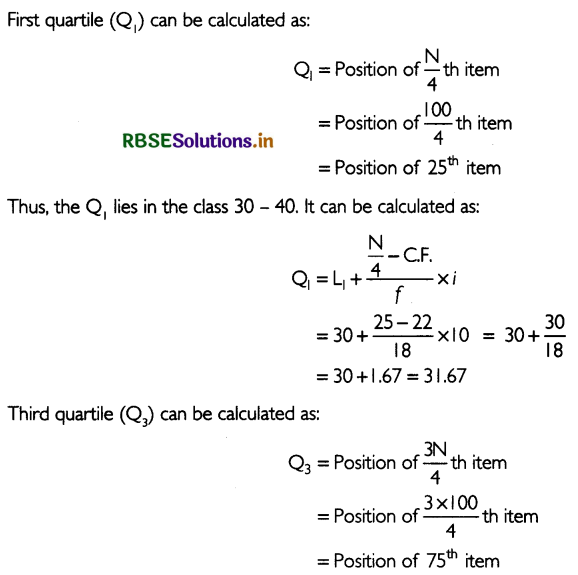
Find the coefficient of quartile deviation from the following series:
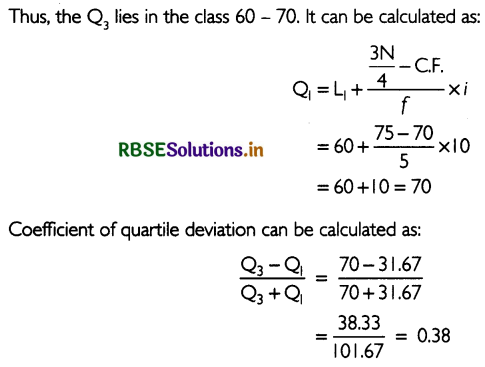
Mean Deviation and its Coefficient
Question 1.
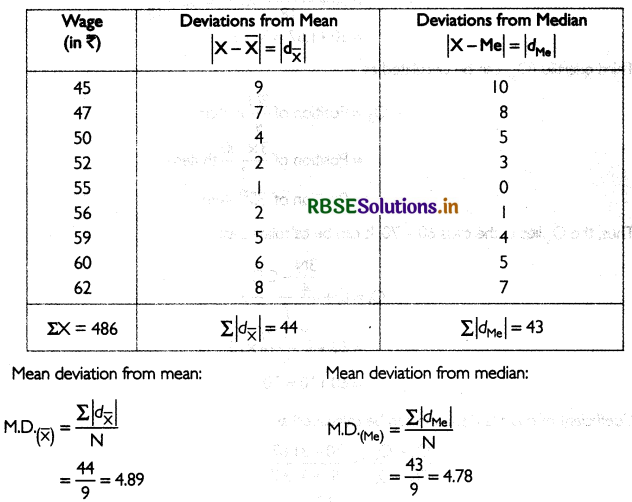
The daily wages (in ₹) of 9 labourers is given. Find mean deviation ‘using mean and median.
45, 47, 50, 52, 55, 56, 59, 60, 62.
Answer:
The sum of the wages, that. 486. Arithmetic Mean of the wages can be calculated as:
\(\bar{X}=\frac{\sum X}{N}=\frac{486}{9}=54\)
Median wage can be calculated as:
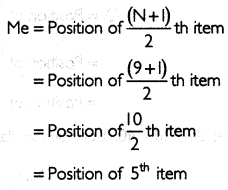
The wage corresponding to this is ₹ 55.
The table below calculates the deviation of each labour's wage from mean and median:
Question 2.
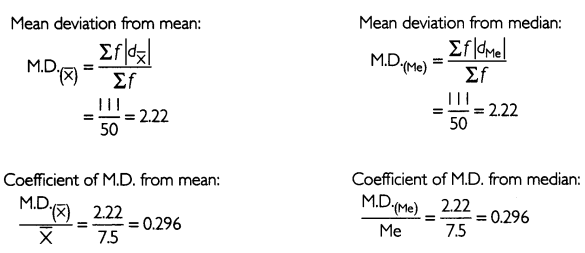
Find the mean deviation from mean and median. Also. find the coefficient of mean deviation for average.

Answer:
First of all, calculate the cumulative frequency (C.F) for the data:
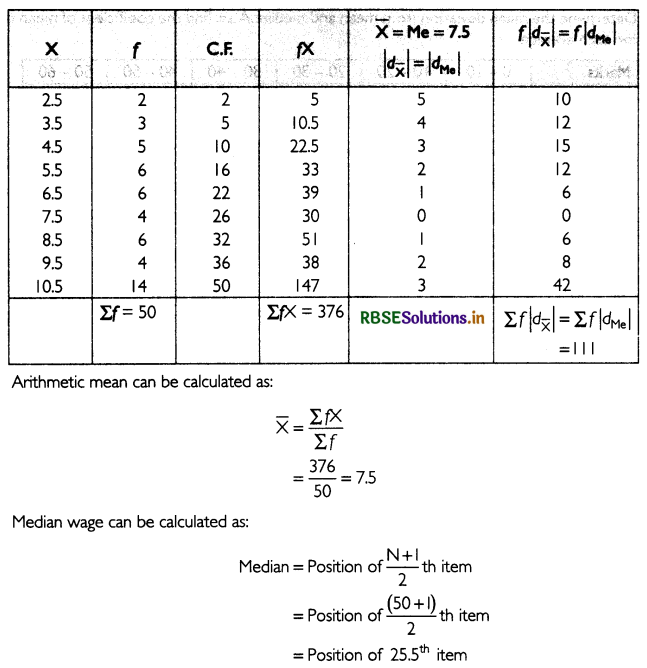

Question 3.
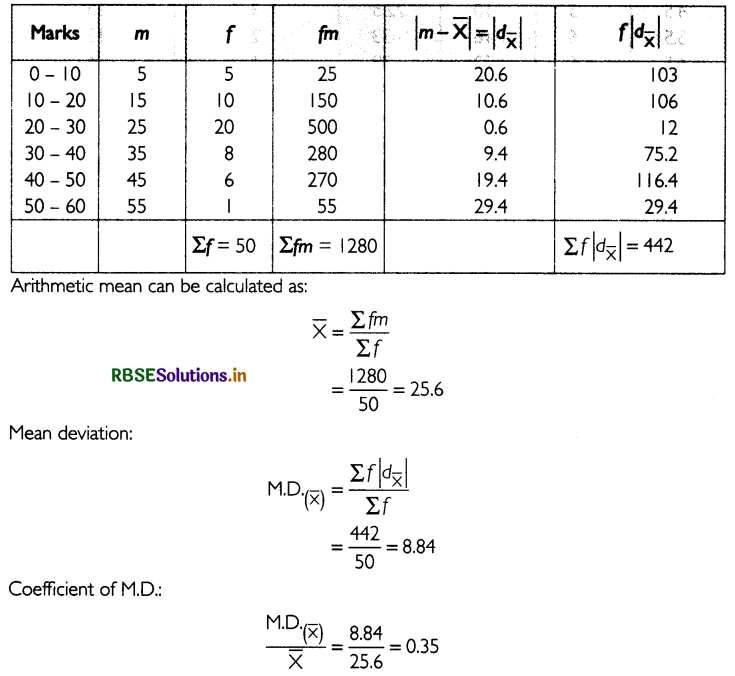
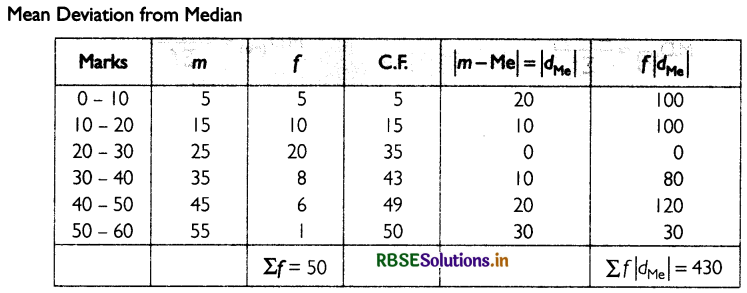
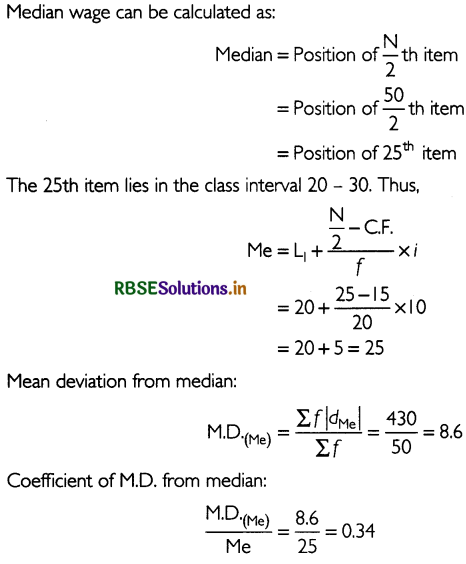
Determine the mean deviation from mean and median also. find the coefficient of mean deviation for each average.

Answer:
Mean Deviation from Mean :

Standard Deviation and Coefficient of Variance
Question 1.
Find standard deviation for the individual series given below.
X: 22, 25, 37, 38, 42, 48, 52, 56
Answer:
The sum of the observations, that is, ∑X = 320. Arithmetic mean of the senes can be calculated as:
\(\bar{X}=\frac{\sum X}{N}=\frac{320}{8}=40\)
The table below calculates the deviation of each value from arithmetic mean: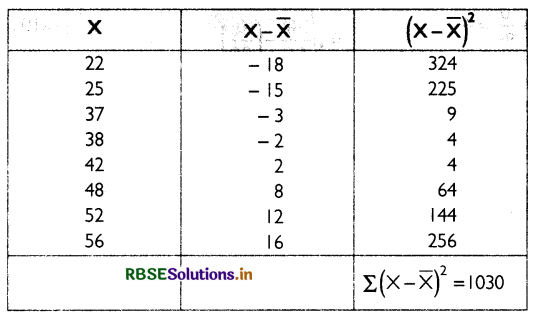
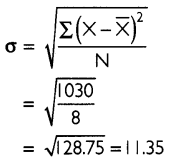
Standard deviation can be calculated by using the formula below.
Question 2.
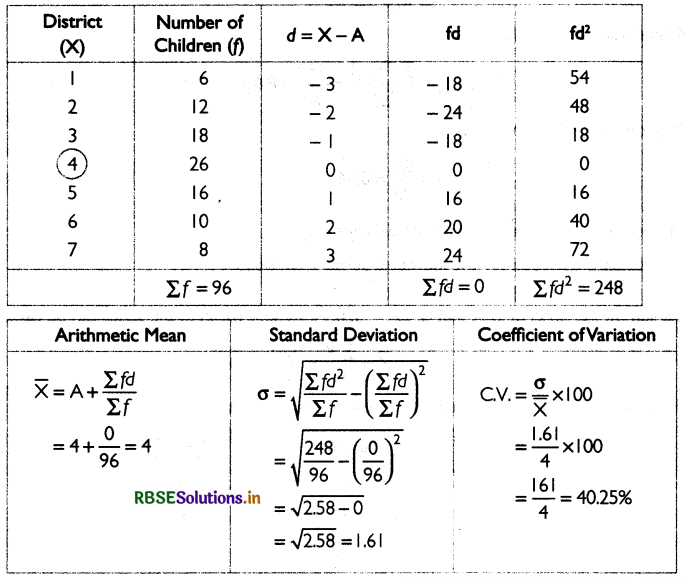
Find standard deviation for the number of children in 7 districts

Answer:
Let the assumed mean for the given data be

Question 3.
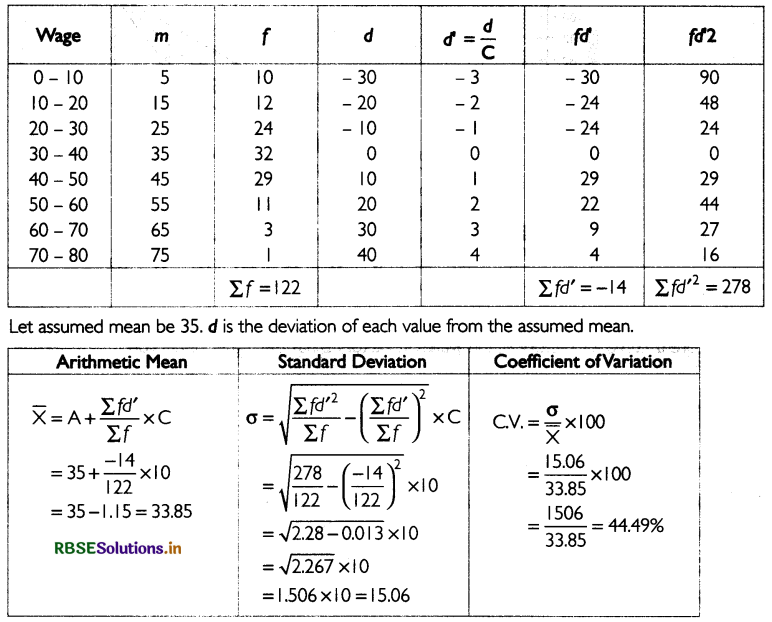
Find coefficient of variance from the following data.
Answer:
The given senes is open-ended distribution, thus, we will first convert it into close-ended distribution,
Lorenz Curve
Question 1.
Construct the Lorenz Curve (or data related to two factories. Find the factory with greater dispersion.

Answer:
The table below calculates the cumulative percentages for the variables.

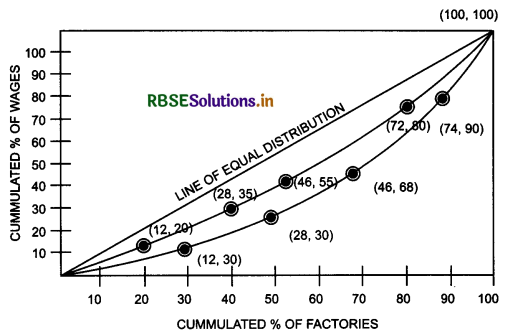
Since the Lorenz curve for Factory B is the farther from line of equal distribution compared to the Loreriz curve for Factory A, the wages at Factory B has the higher dispersion.

Higher Order Thinking Skills
Question 1.
How dispersion of the series different from average of the series
Answer:
Average of the series represents behaviour of all items in the series. However, different items tend to differ from each other and from their average. Dispersion, on the other hand, measures the extent to which different items tend to disperse away from the central tendency.
Question 2.
Why is mean deviation not a very commonly used measure of dispersion?
Answer:
While calculating mean deviation, the deviation of each value from the mean value is computed and the sum is divided by the number of observations. In this calculation, mean deviation turns out to be zero since the positive values above the mean cancel the negative values below the mean.
In order to use this method, the absolute value of the difference needs to be taken so that only positive values are obtained. However, the mathematics are quite complex when using mean deviation in further statistical analysis. Due to this complexity, the average deviation is not a very commonly used measure of dispersion.
Objective Type Questions
Choose the correct answer:
Question 1.
What would be the maximum value of the set, if the minimum value in a set is 2 and its range is 27?
(A) 13
(B) 25
(C) 29
(D) 54
Answer:
(C) 29
Question 2.
Which of the following is an example of application of range in the real world?
(A) Weather forecasts
(B) Fluctuation in share prices
(C) Quality control
(D) All of above
Answer:
(D) All of above
Question 3.
If the interquartile range of the group of numbers 0,4, 7, 15, 30, x, 56 is 37, find the value of x. (Already arranged in ascending order.)
(A) 41
(B) 41.5
(C) 42
(D) 42.5
Answer:
(A) 41
Question 4.
Which of the following is a unit-less measure of dispersion?
(A) Standard deviation
(B) Mean deviation
(C) Coefficient of variation
(D) Quartile Deviation
Answer:
(C) Coefficient of variation
Question 5.
In a distribution, σ = 4. What will be the result if all observations are multiplied by 3?
(A) 12
(B) 7
(C) 6
(D) 4
Answer:
(A) 12

Question 6.
Quartile deviation s equal to:
(A) Inter-quartile range
(B) Half of the inter quartile range
(C) Twice the inter-quartile range
(D) Root of inter-quartile range
Answer:
(A) Inter-quartile range
Question 7.
What is obtained by dividing the sum of all the squared deviations by the total number of observations?
(A) Population deviation
(B) Population variance
(C) Sample deviation
(D) Sample variance
Answer:
(C) Sample deviation
Question 8.
Which of the following measures is most affected by the extreme values?
(A) Standard deviation
(B) Quartile Deviation
(C) Mean Deviation
(D) Range
Answer:
(D) Range

Question 9.
Which measure of dispersion ensures the highest degree of reliability?
(A) Range
(B) Mean deviation
(C) Quartile deviation
(D) Standard deviation
Answer:
(D) Standard deviation
Question 10.
If total sum of square is 40 and the sample variance is 4 then total number of observations are
(A) 5
(B)10
(C) 8
(D)16
Answer:
(B)10

I. Fill in the blanks with correct answer.
1. Each absolute measure has a ______ counterpart.
2. Absolute measures are expressed in terms of____ units of a data.
3. Range is unduly affected by _______ values.
4. _____ is not suitable for open-end distributions.
5. Half of the ____ is quartile deviation.
6. The arithmetic mean of absolute deviations from an average is called ____
7. A change in the values of a distribution will affect the mean deviation the least when calculated from the _______
8. Standard deviation is not independent of _______
9. If variance is 49, the value of standard deviation would be _______
10. The standard deviation of 5 observations is 12. If 4 is added to each observation the value of new standard deviation would be ____
Answers:
1. relative
2. original
3. extreme
4. Range
5. inter-quartile range
6. mean deviation
7. median
8. scale
9. 7
10. 12
Il. State whether the following statements are true or false.
1. Absolute measures are expressed in terms of original units of a data.
2. Relative measures of dispersion are range, quartile deviation, mean deviation and standard deviation.
3. Range is unduly affected by extreme values.
4. Inter-quartile range is based on the top 75 per cent values in the distribution.
5. The algebraic signs (+ or - ) of the deviations are ignored while calculating standard deviation.
6. Mean deviation is the square root of the arithmetic mean of the squares of all deviations.
7. Standard deviation is independent of scale.
8. If the deviations are divided by a common factor, the value of common factor is used in the formula
to obtain standard deviation.
9. A 450 straight line in the Lorenz curve is the line of equal distribution.
10. When there are two or more curves, the one which is the nearest to line of equal distribution has ....... the highest dispersion.
Answers:
1. True
2. False
3. True
4. False
5. False
6. False
7. False
8. True
9. True
10. False
III. Match the following.
|
CoIumn - I |
CoIumn - II |
|
1. Dispersion 2. Absolute dispersion 3. Relative dispersion 4. Range 5. Coefficient of range
9. Lorenz curve 10. Half of the inter-quartile range |
(A) Highest value-Iowest value (B) Expressed in terms of percentage (C) The extent to which values in a distribution vary from the average of the distribution.(D)\(\frac{H-L}{H+L}\) (E) Q3 - Q1 (F) Arithmetic mean of the differences of the values from their average (G) σ (H) Expressed in terms of original units of the data (I) Quartile deviation (J) Graphical presentation of dispersion |
IV. Read the following statement- Assertion (A) and Reason (R). Choose one of the correct alternatives given below:
Assertion (A): Standard deviation is the square root of the arithmetic mean of the squares of all deviations.
Reason (R): Standard deviation is denoted by a.
Alternatives:
(a) Both Assertion (A) and Reason (R) are true and Reason (R) is the correct explanation of Assertion (A).
(b) Both Assertion (A) and Reason (R) are true and Reason (R) is not the correct explanation of
Assertion (A).
(c) Assertion (A) is true and Reason (R) is false.
(d) Assertion (A) is false and Reason (R) is true.
Answer:
(b) Both Assertion (A) and Reason (R) are true and Reason (R) is not the correct explanation of Assertion (A).
V. Read the following hypothetical case study carefully and answer the following questions on the base of the same:
Recall that dispersion was defined as the extent to which values differ from their average. Range and quartile deviation do not attempt to calculate how far the values are from their average. Yet, by calculating the spread of values, they do give a good idea about the dispersion.
Two measures which are based upon deviation of the values from their average are mean deviation and standard deviation. Since the average is a central value some deviations are positive and some are negative. If these are added as they are, the sum ll not reveal anything. In fact, the sum of deviations from Mathmetic mean is always zero.
1. _____ is the extent to which values in a distribution vary from the average of the distribution. (Dispersion/Range)
2. _____ is the difference between the highest and lowest value in a senes. (Range/Dispersion)
3. _____ deviation is the arithmetic average of the deviations of all the values taken from average value of the series. (Mean/Standard)
4. _____ deviation is the square root of the arithmetic mean of the squares of all deviations. (Standard/Mean)
Answers:
1. Dispersion
2. Range
3. Mean
4. Standard

- RBSE Class 11 Economics Important Questions Chapter 9 पर्यावरण और धारणीय विकास
- RBSE Class 11 Economics Important Questions Chapter 3 Organisation of Data
- RBSE Class 11 Economics Important Questions Chapter 2 Collection of Data
- RBSE Class 11 Economics Important Questions Chapter 4 Presentation of Data
- RBSE Class 11 Economics Important Questions Chapter 1 Introduction to Statistics for Economics
- RBSE Class 11 Economics Important Questions in Hindi & English Medium
- RBSE Class 11 Economics Important Questions Chapter 8 Index Numbers
- RBSE Class 11 Economics Important Questions Chapter 7 Correlation
- RBSE Solutions for Class 11 Economics in Hindi Medium & English Medium
- RBSE Class 11 Economics Important Questions Chapter 5 Measures of Central Tendency
- RBSE Solutions for Class 11 Economics Chapter 7 Correlation