RBSE Class 11 Economics Important Questions Chapter 5 Measures of Central Tendency
Rajasthan Board RBSE Class 11 Economics Important Questions Chapter 5 Measures of Central Tendency Important Questions and Answers.
RBSE Class 11 Economics Important Questions Chapter 5 Measures of Central Tendency
Very Short Answer Type Questions
Question 1.
What do you mean by central tendency?
Answer:
A central tendency refers to a average or representative value of a statistical series.
Question 2.
In how many parts is statistical average divided?
Answer:
Statistical average is divided into two parts:
(i) Mathematical average
(ii) Positional average

Question 3.
What are the types of positional average?
Answer:
The different types of positional average are:
(i) Median
(ii) Mode
(iii) Partition values - quartiles, deciles and percentiles
Question 4.
State the relation between mean, median and mode.
Answer:
The relationship between mean, median and mode can be represented with the help of the following formula:
Mode = 3Median - 2Mean
Mo = 3Me - \(2 \bar{X}\)
Question 5.
Define Arithmetic mean
Answer:
Arithmetic mean is the sum total of all the observations divided by the number of observations.
Question 6.
State the types of arithmetic mean.
Answer:
There are two types of arithmetic mean:
(i) Simple arithmetic mean
(ii) Weighted arithmetic mean

Question 7.
Give the formula for calculating arithmetic mean in a continuous series using step deviation method.
Answer:
The formula for calculating arithmetic mean in a continuous series using step deviation method is given as:
\(\bar{x}=A+\frac{\sum f d^{\prime}}{\sum f} \times C\)
Question 8.
State an important property of arithmetic mean.
Answer:
An important property of arithmetic mean states that the sum of deviations of items about arithmetic mean is always equal to zero, that is, \(\Sigma(X-\bar{X})=0\)
Question 9.
What is weighted arithmetic mean?
Answer:
Weighted arithmetic mean is the mean calculated on the basis of weights assigned to the various items, according to their relative importance.
Short Answer Type Questions
Question 1.
State the main functions of averages.
Answer:
The following are the main functions of averages:
(i) Facilitate Comparisons: Averages make the whole series easy and definite thereby facilitating comparison. For example, by comparing average per capita income of different countries, the countries with the highest and lowest economic growth can be identified.
(ii) Help in the Formulation of Policies: Averages help in the formulation of policies. For example, if the government finds low level of literacy in certain areas, it can formulate appropriate policies to improve educational services.
(iii) Form the Basis for Statistical Analysis: The results derived from calculation of averages can easily be utilised to conduct statistical analysis and draw inferences.
(iv) Represent the Whole Series: Averages represent the series as a whole.

Question 2.
State the properties of an ideal average.
Answer:
The following are the main properties of an ideal average:
(i) Easy to Compute and Understand: The process of calculation of average should be simple and easy. If the calculation involves complex mathematical processes, it will not be readily; understood. As a result its use will be confined only to experts.
(ii) Rigid Definition: An average left to the observation of the investigator would be bias and hence, cannot represent the entire series. A rigidly defined average would always result in a definite figure.
(iii) Represent the Whole Series: It should be based on all the observations of the series. If some; of the items of the series are ignored in the calculation, the average cannot be said to be a representative one.
(iv) Open to further Algebraic Treatment: If an average is not capable of further algebraic treatment, its use would be very limited.
(iv) Not Affected by Sampling Fluctuations: The averages of two independent sample studies in any particular field should not differ much from each other. The averages with least fluctuation; of sampling are considered better than those with more difference.
Question 3.
Explain the relationship between mean, median and mode on the basis of distribution.
Answer:
In symmetric distribution, the values of mean, median and mode are the same, that is,
\(\bar{X}\)= Me = Mo
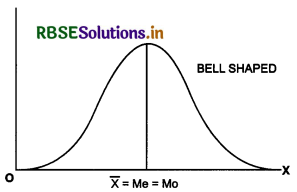
Thus, a symmetric distribution curve is bell-shaped. However, in asymmetric distribution:
(i) If the distribution is skewed to the right (or positively skewed) then Mo < Me < \(\bar{X}\)
(ii) If the distribution is skewed to the left (or negatively skewed) then \(\bar{X}\)< Me < Mo


Question 4.
Define Median.
Answer:
Median is the measure of central tendency that divides the distribution into two equal parts.
Question 5.
Give formula for finding median.
Answer:
The median can be calculated as:
Median = Position of \(\frac{(\mathrm{N}+\mathrm{I})}{2} \text { th }\) item
Question 6.
How does mean depend on the number of values in a series?
Answer:
When the number of values is odd, median is the middle most value. However, when the number of values is even, median is the arithmetic mean of the two middle values.
Question 7.
Write the formula for calculating median in continuous series.
Answer:
In continuous series, the formula for calculating median is:
\(M e=L_1+\frac{\frac{N}{2}-C . F .}{f} \times i\)
where; L1 = Lower limit of the median class
N = Sum of the items in the series
C.F. = Cumulative frequency corresponding to the class before the median class
f = Frequency corresponding to the median class
i = Class size
Question 8.
What are partition values?
Answer:
The partition values divide the series into more than two equal parts. Quartiles, deciles and percentiles are the different types of partition values.
Question 9.
What are percentiles?
Answer:
Percentiles divide the distribution into 100 equal parts.
Question 10.
What is mode
Answer:
Mode is the value with the highest frequency in the distribution.
Question 11.
Give the formula for calculating mode in continuous series.
Answer:
In continuous senes, the formula for calculating mode is:
\(M 0=L_1+\frac{f_1-f_0}{2 f_1-f_0-f_2} \times i\)
where:
L1 = Lower limit of the modal class
f1 = Frequency corresponding to the modal class
f0 = Frequency corresponding to the class before the modal class
f2 = Frequency corresponding to the class after the modal class
i = Class size

Question 12.
List two different types of modal data.
Answer:
The different types of modal data are
(i) Uni-modal Data - data with unique mode
(ii) Bi-modal Data - data with two modes
(iii) Multi-modal Data - data with more than two modes
Question 13.
When it is appropriate to use inspection method to identify model value of a series
Answer:
It is appropriate to use inspection method to identify model value of a senes when all the items in the series have different frequencies.
Question 14.
Explain the calculation of simple arithmetic mean.
Answer:
Arithmetic mean is the sum total of all the observations divided by the number of observations.
Mean is denoted by \(\bar{X}\). Arithmetic mean is given by
\(\bar{X}=\frac{X_1+X_2+X_3+\ldots+X_N}{N}=\frac{\sum X}{N}\)
where; X1, X2, X3, ...., XN = Values of the observations
∑X= Sum of all observations
N = Total number of observations
Example: Calculate the arithmetic mean for the data showing the money spent by 5 friends at a lunch.

Solution:
Arithmetic mean can be calculated as:
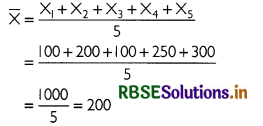
Thus, the average money spent is ₹ 200.
Question 15.
How is combined arithmetic mean calculated?
Answer:
Given the arithmetic mean of two or more than two series, combined mean can be computed using the formula given below:
\(\bar{X}_{12}=\frac{\overline{X_1} N_1+\bar{X}_2 N_2}{N_1+N_2}\)
Where
\(\bar{X}\)12 = Combined Mean
X2 = Mean of Ist series
N1 = Number of observations in 1st series
X2 = Mean of 2nd series
N2 = Number of observations in 2nd series

Question 16.
What are the merits of arithmetic mean?
Answer:
The following are the merits of arithmetic mean:
(i) Arithmetic mean is the simplest of all averages. It is easy to understand and calculate.
(ii) Arithmetic mean is dependent on all the items of a series so it represents the whole series.
(iii) It is a stable average as it is not influenced by the fluctuations of samples.
(iv) Arithmetic mean has various algebraic features so that it can be used in higher statistical analysis.
(v) Arithmetic mean is a definite number and not an estimate.
(vi) Groups can be compared with the help of arithmetic mean.
(vii) Accuracy of arithmetic mean can be checked.
Question 17.
What are the demerits arithmetic mean?
Answer:
The following are the demerits of arithmetic mean:
(i) Extreme values cause huge variations of central value from certain observations in the series such that the arithmetic mean no longer represents the whole series.
(ii) It sometimes gives unrealistic results such as the average number of children in a family as 4.5, which is not possible. Value of mean is such that it is not a value from series like average of 2, 3, 7 would be 4 which is not in the series.
(iii) Arithmetic mean is suitable only for quantitative data.
(iv) It is not suitable for ratio, rate or percentage study.
Question 18.
Write a short note on weighted arithmetic mean.
Answer:
Weighted arithmetic mean is the mean calculated on the basis of weights assigned to the various items, according to their relative importance. For example, a person spends his entire income on items such as food (f), clothes (c) and entertainment (e). The arithmetic mean will be (f + c + e)/3. However, he may want to give more importance to food. For this, he may use as ‘weights’ the amount of food (q1), the amount of clothes (q2) and the amount of entertainment (q3). Hence, the arithmetic mean weighted by the quantities would be (fq1+ cq2 + eq3)/(q1 + q2+ q3).

Question 19.
Write the steps of calculation of weighted arithmetic mean.
Follow the steps given below to calculate weighted arithmetic mean:
(i) Assign weight to all the items according to their importance and denote them as W.
(ii) Multiply the value of each item (X) with their respective weights (W) to get XW.
(iii) Find their sum; ∑XW.
(iii) Find the sum of weights; ∑W.
(iv) Divide ∑XW by ∑W to get the weighted mean.
According to formula:
\(\bar{X}_W=\frac{\sum \times W}{\sum W}\)
Question 20.
State the important features of median.
Answer:
Median has the following features
(i) It is easy to understand and compute.
(ii) It is not affected by extreme values.
(iii) It is a definite and clear average.
(iv) It can also be determined graphically.
(v) Since it is among the values of the series, it is a real value.
(vi) Median can also be determined easily in open-end series.
Question 21.
What are the demerits of median?
Answer:
The following are the demerits of median:
(i) It lacks algebraic characteristics as it cannot be used in further mathematical processes.
(ii) In case of even number of items or continuous series, it is an estimated value other than the values in the series.
(iii) When there is a large difference in the values of items, median is not an appropriate method.
(iv) To calculate median, series needs to be arranged in ascending or descending order, which is a lengthy process.
Question 22.
Write a short note on quartiles.
Answer:
The quartiles divide the distribution in four parts. There are three quartiles:
(i) First Quartile (Q1), also known as lower quartile, has 25% of the items below it and 75% of the items above it.
(ii) Second Quartile (Q2), also known as median, has 50% of items below it and 50% of items above it
(iii) Thind Quartile (Q3), also known as upper quartile, has 75% of items below it and 25% of the items above it

Question 23.
Write the formula for the following: Q3, D7, P2 and P79.
Answer:
The formulae for each of the positional averages are given below:

Question 24.
State the advantages of mode as a measure of central tendency.
Answer:
The advantages of mode are as below
(i) It is easy to understand and use as some time sit can be determined by inspection only.
(ii) It is not affected by extreme values.
(iii) It can be caculated for open-end classes.
(iv) It can be easily determined by graphical method.
Question 25.
What are the demerits of mode as a measure of central tendency.
Answer:
The demerits of mode are as below
(i) It ignores extreme values.
(ii) It is not suitable for further algebraic use.
(iii) Since it depends on grouping, the value of mode also changes with the change in the range of group.
(iv) ft is the most unclear and non-definite average.
Question 26.
Write short note on the uses of mode.
Answer:
Mode shows the centre of concentration of the frequency around a particular value. Thus it is preferred when the purpose is to identify the point of the highest concentration. it is. therefore,a positional average. It is used in weather science, bio-medical science, trade and industries. For example, in placing an order for shoes or ready-made garments the modal size helps significantly as it identifies the size, which is the most common in demand.
Long Answer Type Questions
Question 1.
Explain the different methods for calculating arithmetic mean in discrete series.
Answer:
In discrete series, value of the items are given along with their respective frequencies. Arithmetic mean in discrete series can be calculated by using the following methods:
Direct Method: In discrete series, arithmetic mean by direct method is calculated as follows:
(i) Each item is presented by X and frequencies by f.
(ii) Find the product of each value with the respective frequency, i.e. fX
(iii) Add the product to obtain ∑ fX.
(iv) Find the sum of the frequencies as ∑f.
(v) Divide the sum of the product (∑fX) by the sum of the frequencies (∑f) to obtain arithmetic mean.

According to formula:
\(\bar{X}=\frac{\Sigma f x}{\sum f}\)
Short-cut Method:
In this method, following are the steps to calculate arithmetic mean:
(i) Take any value from the middle of the series as assumed mean, A.
(ii) Find the deviation (d) of each value of the series from the assumed mean (d = X - A). It can be either positive or negative.
(iii) Find the product of each deviation with the respective frequency, i.e. fd.
(iv) Add the product to obtain Ifd.
(v) Find the sum of the frequencies as If.
(vi) Divide Ifd by If.
(vii) Add the value of assumed mean (A) to the result obtained in step(vi) to get arithmetic mean.
According to formula:
\(\bar{X}=A \pm \frac{\Sigma f d}{\Sigma f}\)
Step-deviation Method: In this method, following are the steps to calculate arithmetic mean:
(i) Take any value from the middle of the series as assumed mean, A.
(ii) Find the deviation (d) of each value of the series from the assumed mean (d = X - A). It can be either positive or negative.
(iii) Divide the deviation by the common factor (C) to obtain step-deviation, d'.
(iv) Find the product of each step-deviation with the respective frequency, i.e. fd'.
(v) Add the product to obtain ∑fd'.
(vi) Find the sum of the frequencies as ∑f.
(vii) Divide ∑d' by If and multiply the result with C.
(viii) Add the value of assumed mean (A) to the result obtained in step (vii) to get arithmetic mean. According to formula:
Question 2.
Define median. Explain the steps for calculating median in different series.
Answer:
Median is the measure of central tendency that divides the distribution into two equal parts. Individual Series:
Follow the steps given below to calculate median for an individual series:
(i) Arrange the data in ascending or descending order. In both ways, centre point is the same.
(ii) Find the median by applying the formula \(\frac{(N+1)}{2} \text { th }\) item.
(iii) If the number of values is odd, median is the middle-most value.
(iv) If the number of values is even, median is the arithmetic mean of the two middle values.
Discrete Series: Follow the steps given below to calculate median for a discrete series:
(i) Arrange the series in ascending or descending order.
(ii) Convert the absolute frequencies into cumulative frequencies.
(iii) Find the position of median by applying the formula \(\frac{(N+1)}{2} \text { th }\)item

Continuous Series: Follow the steps given below to calculate median for a continuous series:
(i) Arrange the class intervals in ascending or descending order.
(ii) Convert the absolute frequencies into cumulative frequencies.
(iii) Find the position of median by applying the formula \(\frac{N}{2} \text { th }\) item.
Median class corresponds to the cumulative frequency that includes \(\frac{N}{2} \text { th }\)item.
(iv) Find the median by applying the following formula:
\(M e=L_1+\frac{\frac{N}{2}-C . F .}{f} \times i\)
Question 3.
How can median be located graphically ? Explain ?
Answer:
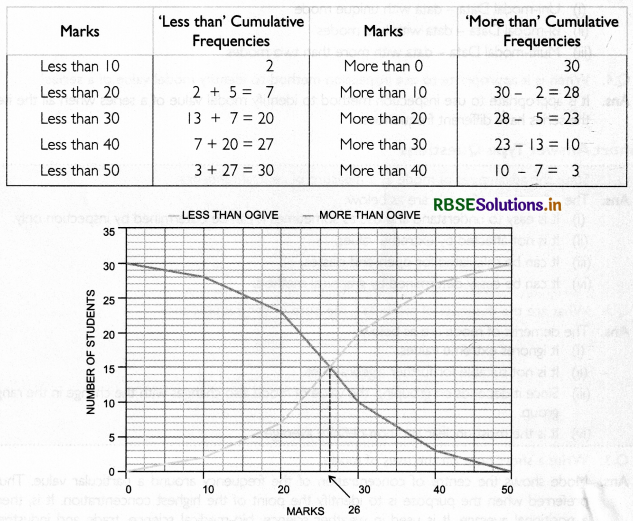
Median can be located graphically with the help of the cumulative frequency curve or 'ogive'. The steps for locating median in a grouped data are given below:
(i) Calculate less than and more than values.
(ii) Represent the class boundaries without gaps between consecutive classes on the x-axis and frequency on the y-axis.
(iii) Draw 'less than’ and ‘more than’ ogive curves.
(iv) Draw perpendicular on the x-axis from the point of intersection of these two curves.
(v) The value at which the perpendicular meets the x-axis will give the median.
Example: Find the median of the data given below using graph.

Solution:
Below is the table showing the ‘less than’ and 'more than' cumulative frequencies:

Question 4.
Define mode. How is mode calculated in different series using inspection method.
Answer:
Mode is the value with the highest frequency in the distribution.
For calculation of mode through inspection method, the series must be regular and homogeneous.
The process of calculating mode in different series using inspection method has been explained below
(i) Individual Series: In individual series, the value which repeats the most times is the mode.
Example: Age of 20 students of a class is given. Find mode.
22,25, 17, 19,17,20, 19, 22,21, 22, 21,24, 23, 23, 23,21, 18, 19, 17,23
Solution:
Arrange the series in ascending order as
17, 17, 17, 18, 19, 19, 19, 20, 21, 21, 21, 22, 22, 22, 23, 23, 23, 23, 24, 25
It is clear from the re-arranged data that age 23 is repeating this the most.
Thus, Mode =23 years
(ii) Discrete Series: In discrete senes, the value with the highest frequency is the mode.
Example: The following table gives age of 50 people. Find mode.

Solution: In the above table, the highest frequency is 18. which corresponds to the value 23.
Thus, Mode = 23.
(iii) Continuous Series: In continuous series, the class with maximum frequency is inspected for mode. After identifying the modal class, the value of mode can be calculated by using the following formula:
\(M 0=L_1+\frac{f_1-f_0}{2 f_1-f_0-f_2} \times i\)
where;
L1 = Lower limit of the modal class
f1= Frequency corresponding to the modal class
f0 = Frequency corresponding to the class before the modal class
f2 = Frequency corresponding to the class after the modal class
i = Class size
Question 5.
When is grouping method used for calculating mod& Explain the steps for calculating mode using grouping method.
Answer:
Grouping method is used for calculating mode when:
(i) the maximum frequency is repeated; or
(ii) the frequencies are irregular.
In this method, two tables are constructed namely the grouping table and analysis table. The following are the steps for calculating mode using the grouping method:
(i) Construct six columns in the grouping table.
(ii) In column 1, note the frequencies and mark the highest one.
(iii) In column 2. add the frequencies in the group of two.
(iv) In column 3, ignore the first frequency and then add the frequencies in the group of two.
(y) In column 4, add the frequencies in the group of three.
(vi) In column 5, ignore the first frequency and then add the frequencies in the group of three.
(vii) In column 6, ignore the first two frequencies and then add the frequencies n the group of three.
(viii) Mark the highest frequency in each column.
(ix) Form the analysis table to detemine the modal class.
(x) Find the mode using the formula given below
\(M o=L_1+\frac{f_1-f_0}{2 f_1-f_0-f_2} \times i\)
Numerical Questions
Arithmetic Mean:
Question 1.
Marks of 10 students in Statistics examination are given below. Find arithmetic mean.

Answer:
For the given data, arithmetic mean can be calculated as:
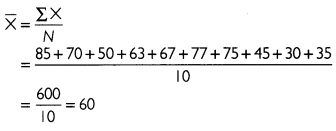
Thus, the average marks of students in Statistics examination is 60.

Question 2.
The table below shows the per hour pay of 25 landless agricultural labourers. Find Arithmetic mean by direct method.

Answer:
For the given data, the arithmetic mean can be calculated as:
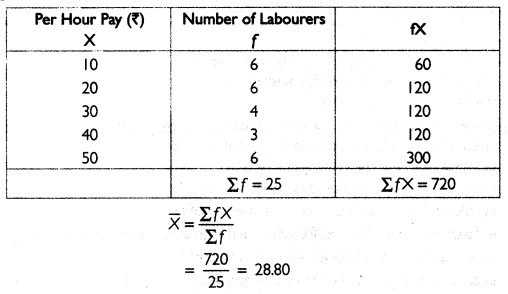
Thus, the average per-hour pay of 25 landless agricultural labourers is ₹ 28.80.
Question 3.
Calculate arithmetic mean of the given data.

Answer:
For the given data, arithmetic mean can be calculated as:
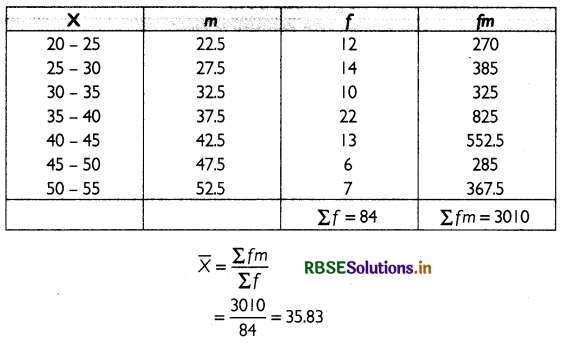
Thus, the arithmetic mean of the given data is 35.83.

Question 4.
Calculate arithmetic mean of the following data using short-cut method:

Answer:
Let A = 47. For the given data, arithmetic mean can be calculated as:
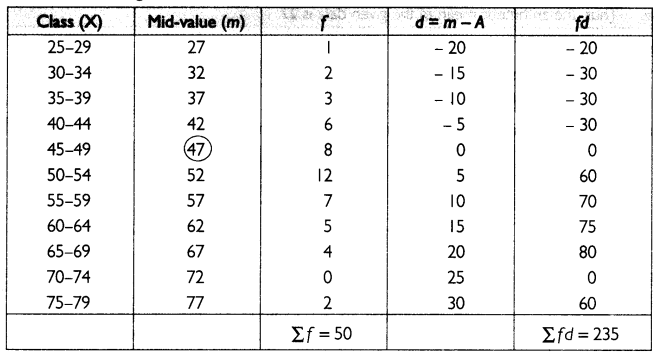
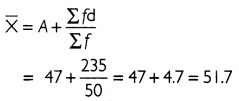
Thus, the arithmetic mean of the given data is 51.7
Question 5.
Find the mean wage rate by using step deviation method.

Answer:
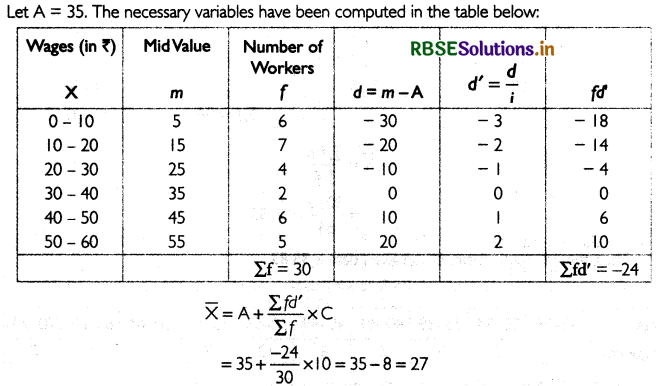
Thus, the arithmetic mean of the given data is 27.
Question 6.
Calculate weighted mean from the following data:

Answer:
For the given data, weighted mean can be calculated as:
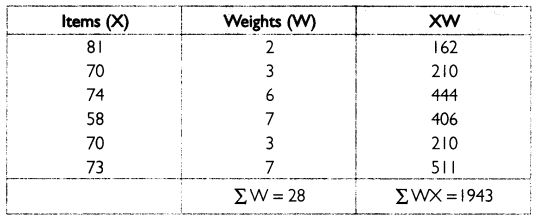
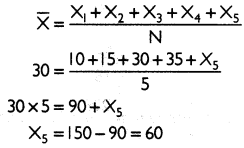
Thus, the value of the missing item is 60.

Median
Question 1.
Find out the median of the given discrete series.
Answer:
Calculate the cumulative frequency as shown below
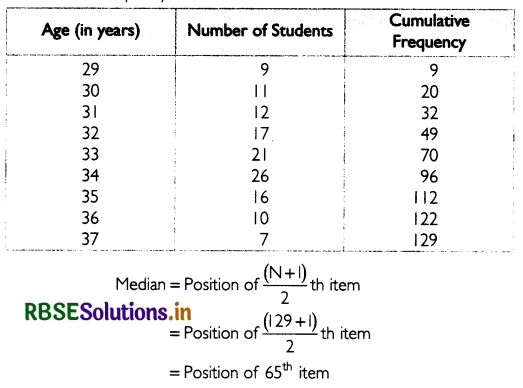
The 65th observation lies in the cumulative frequency of 70. The age corresponding to this is 33. Thus, the median age is 33 years.
Question 2.
Find the median from the following data

Answer:
There is no need to make the intervals equal for the given series for calculating median.
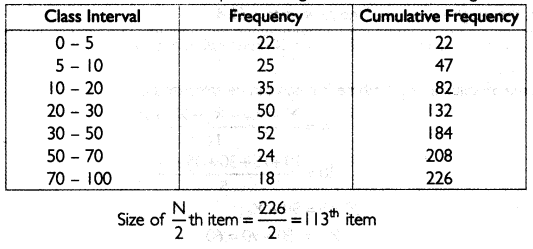
Thus,the median lies in the class 20 - 30. Median can be caked by using the formula given below
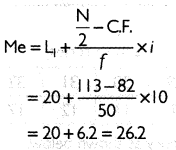
Thus, the median of the series is 26.2.
Question 3.
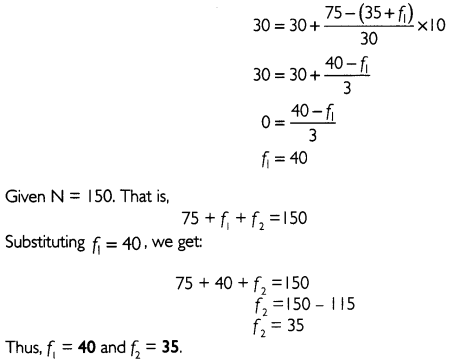
If N 150 and Median 30 then find out the unknown value in the given distribution.
Answer:
Given, N = 150 and Median 30
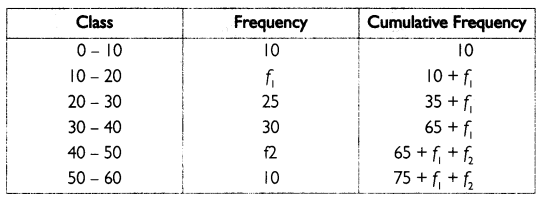
Median lies in the class 30 - 40. Median can be calculated by using the fomula given below.


Question 4.
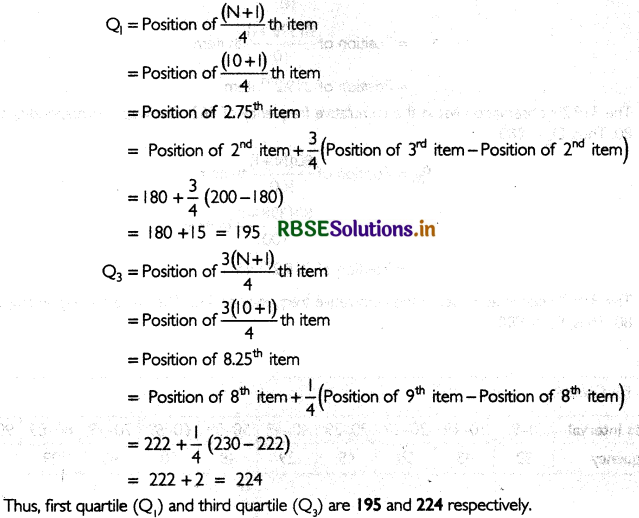
Monthly wages of 10 farmers are given, find first and third quartile.

Answer:
The given data is already in ascending order.
Question 5.
Find D80 and P80

Answer:
Calculate the cumulative frequency as shown below:
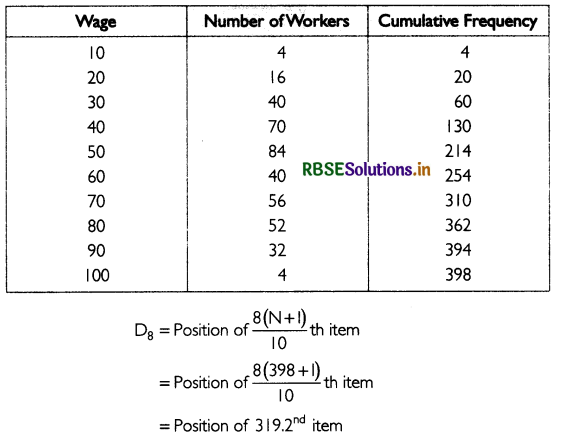
The 319. 2nd observation lies in the cumulative frequency of 362. The wage corresponding to this is 80. Thus, D8 = ₹80.
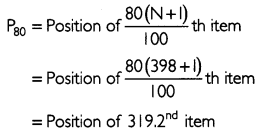
The 319.2nd observation lies in the cumulative frequency of 362. The wage corresponding to this is 80. Thus, P80, = ₹80.
Mode
Question 1.
Find mode.

Answer:
The given series is an inclusive series. Thus, it needs to be converted into exclusive series first in the grouping table as below:
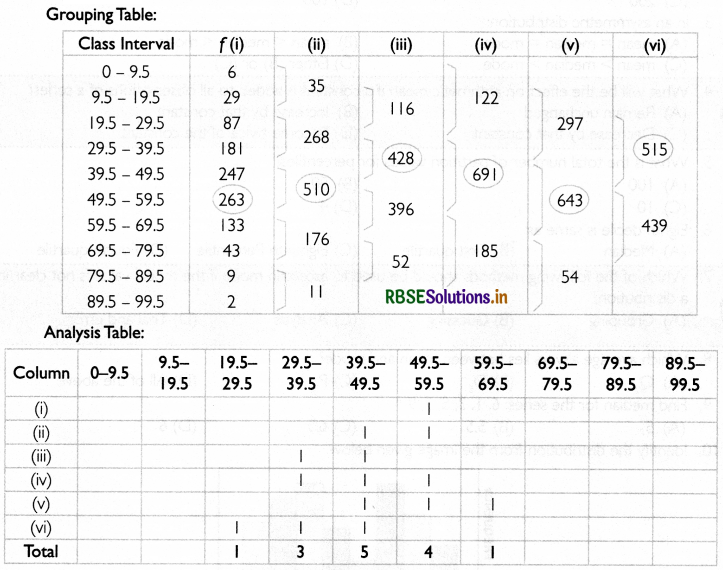
It can be seen from the analysis table that the value of mode lies in the class interval 39.5 - 49.5.
Mode can be calculated by using the formula given below:
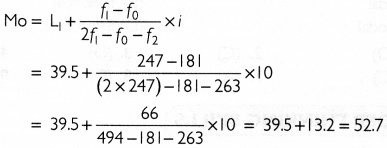
Thus, the mode of the given series is 52.7

Higher Order thinking Skills
Question 1.
Explain the estimation of arithmetic mean under the following circumstances:
(i) Inclusive class intervals are given
(ii) Open-end class intervals are given
(iii) Cumulative series is given
Answer:
(i) When inclusive class intervals are given, the senes converted exclusive senes to compute mean.
(ii) When open-end class intervals are given, missing class limits are assumed based on the pattern of given class intervals.
(iii) When cumulative series is given, the series is converted into simple frequency senes.
Question 2.
The median and mean of a series are 20 and 22.5. Find mode. Comment on the shape of the distribution curve.
Answer:
Given Me = 20 and = 223. The relationship between mean, median and mode can be represented
with the help of the following formula
Mode = 3 Median - 2Mean
Mo = 3Me - 2
Substituting the appropriate values, we get
Mo = (3 x 20) - (2 X 22.5)
Mo = 60 - 45 = 15
Thus, the mode of the distribution is 15.
Since Mo < Me \(\bar{X}\) , the distribution is asymmetric The distribution is skewed to the riait or positively skewed
Objective Type Questions
Choose the Correct Answers:
Question 1.
Which of the following is also known as a measure of central tendency?
(A) Ratio
(B) Proportion
(C) Fraction
(D) Statistical Average
Answer:
(D) Statistical Average
Question 2.
The arithmetic mean of 100, 200, 150. 250 and 300 is:
(A) 1000
(B) 500
(C) 200
(D) 100
Answer:
(C) 200
Question 3.
In an asymmetric distribution:
(A) mean = median = mode
(B) mean < median <mode
(C) mean > median > mode
(D) Either (B) or (C)
Answer:
(D) Either (B) or (C)

Question 4.
What will be the effect on arithmetic mean if a constant is added to all observations of a senes?
(A) Remain unchanged
(B) Increase by that constant
(C) Decrease by that constant
(D) Become twice of the constant
Answer:
(B) Increase by that constant
Question 5.
What is the total number of partition values for percentiles?
(A) 100
(B) 50
(C) 10
(D) 4
Answer:
(A) 100
Question 6.
Eighth decile is same as:
(A) Median
(B) First quartile
(C) Eightieth Percentile
(D) Fourth quartile
Answer:
(C) Eightieth Percentile
Question 7.
Which of the following methods should be used to ascertain mode if the modal value is not clear in a distribution?
(A) Grouping
(B) Guessing
(C) Analysis
(D) Trial and error
Answer:
(A) Grouping
Question 8.
Which average always lies between mean and mode?
(A) Q2
(B) D5
(C) P50
(D) All of the above
Answer:
(D) All of the above
Question 9.
Find median for the series: 6, 1, 3, 5, 7,9
(A) 5
(B) 5.5
(C) 6.5
(D) 6
Answer:
(B) 5.5

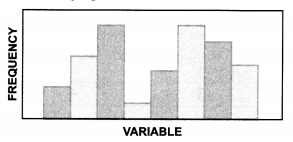
Question 10.
ldentify the distribution from the image given below.
(A) Uni-modal
(B) Bi-modal
(C) Mufti-modal
(D) Symmetric
Answer:
(B) Bi-modal
I. Fill in the blanks with correct answer.
I. The relationship between mean, median and mode for a symmetrical distribution is ____.
2. If we subtract 10 from each observation of a set, the mean of the data will be reduced by ____
3. The sum of the deviations about mean is ____.
4. Median divides a senes into equal parts ____.
5. ____ divides the total number of observations into 10 equal parts,
6. Median is a more suited average for grouped data with classes.
7. 2nd quartile and ____ percentile are the same.
8. Histogram is useful to determine the value of ____ graphically.
9. The value which occurs with the most number of times is called
10. The data with two modes is called distribution.
Answers:
1. X Me = Mo
2. 10/ten
3. zero
4. Two
5. Decile
6. unequal
7. 50th
8. mode
9. mode
10. bimodal

II. State weather the following statements are true or false:
1. Mean is not affected by extreme values.
2. Arithrnetic mean is a definite number and not an estimate.
3. Third quartile represents median.
4. Even if the grouped data has open-end classes it is possible to calculate median.
5. Median can be located graphically with the help of ogive.
6. First quartile (Q I) has 75% of the items below it.
7. ‘Men the number of values is even, median is the sum of the two middle values.
8. Percentiles divide the distribution into I 00 equal parts.
9. Median and mode are positional averages.
10. Grouping method is suitable to identify model value of a series when all the items in the senes have
different frequencies.
Answers:
I. False
2. True
3. False
4. True
5. Thie
6. False
7. False
8. True
9. True
10. False
Ill. Match the following.
|
Column-I |
Column-II |
|
I. Central tendency 2. Mean 3. Median 4. Mode 5. Lower quartile 6. Q2 7. Upper Quartile 8. Decile 9. Percentile 10. The value which occurs most frequently |
(A) \(Li+\frac{f_1-f_0}{2 f_1-f_0-f_2} \times i\) (B) \(\left(\frac{N+1}{2}\right)^{\text {th }} \text { item }\)
(E) 75% of the items of the distribution below it (F) 25% of the items of the distribution below it (G) Median (H) Divide the distribution into 100 equal parts (I) Mode (J) Divide the distribution into 10 equal parts |
Answers:
1. (C) 2. (D) 3. (B) 4. (A) 5. (F) 6. (G) 7. (E) 8. (J) 9. (H) 10. (I)

IV. Read the following statement- Assertion (A) and Reason (R). Choose one of the correct alternatives given below:
Assertion (A): The sum of deviation of items from median is zero.
Reason (R): Median is simply the middle most value of the distribution.
Alternatives:
(a) Both Assertion (A) and Reason (R) are the and Reason (R) is the correct explanation of Assertion (A).
(b) Both Assertion (A) and Reason (R) are true and Reason (R) is not the correct explanation of Assertion (A).
(c) Assertion (A) is true and Reason (R) is false.
(d) Assertion (A) is false and Reason (R) is true.
Answer:
(d) Assertion (A) is false and Reason (R) is true.
V. Read the following hypothetical case study carefully and answer the following questions on the base of the same:
Suppose the monthly income (in Rs.) of six families is given as:
1600, 1500, 1400, 1525, 625, 1630.
The mean family income is obtained by adding up the incomes and dividing by the number of families.
Mean Family Income = \(\frac{1600+1500+1400+1525+1625+1630}{6}=₹ 1,547\)
It implies that on an average, a family earns ₹ 1547.
Arithmetic mean is the most commonly used measure of central tendency. it is defined as the sum of the
values of all observations divided by the number of observations; and is usually denoted by - In general, if there are N observations as X1, X2,X3,......... Xn then the Arithmetic mean is given by

(where ∑X = sum of all observations and N = total number of observations)
1. A_____________ refers to an average or a representative value of a statistical senes. (central tendency/mean)
2. ____________ is the sum total of all the observations divided by the number of observations.
(Arithmetic mean/Mode)
3. ___________ is the most affected by the presence of extreme items. (Mode/Arithmetic mean)
4. The algebraic sum of deviation of a set of N values from the Arithmetic mean is ............. (0/1)
Answers:
1. central tendency
2. Arithmetic mean
3. Arithmetic mean
4. 0
