RBSE Solutions for Class 10 Maths Chapter 14 Statistics Ex 14.4
Rajasthan Board RBSE Solutions for Class 10 Maths Chapter 14 Statistics Ex 14.4 Textbook Exercise Questions and Answers.
Rajasthan Board RBSE Solutions for Class 10 Maths in Hindi Medium & English Medium are part of RBSE Solutions for Class 10. Students can also read RBSE Class 10 Maths Important Questions for exam preparation. Students can also go through RBSE Class 10 Maths Notes to understand and remember the concepts easily. Make use of our handy algebraic arithmetic sequences calculator and find the Sum of n terms of the arithmetic sequence.
RBSE Class 10 Maths Solutions Chapter 14 Statistics Ex 14.4
Question 1.
The following distribution gives the daily income of 50 workers of a factory.
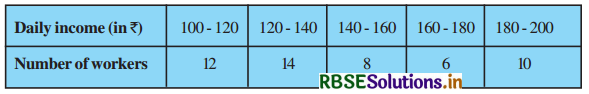
Convert the distribution above to a less than type cumulative frequency distribution, and draw its ogive.
Solution:
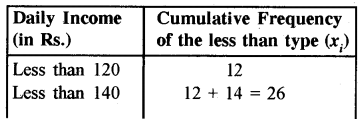
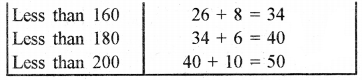
Cumulative Frequency Distribution of the ‘less than’ Type
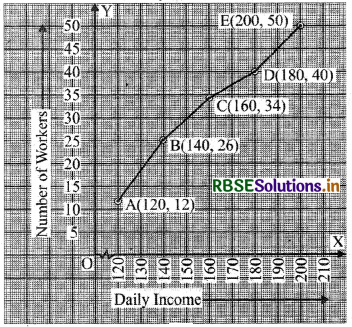
(i) We plot all the points A(120, 12); B(140, 26); C(160, 34); D(180, 40); E(200, 50) on a graph paper.
(ii) Joining the plotted points by a free hand smooth curve we get a cumulative frequency curve or an ogive.
We get the graph of the cumulative frequency distribution of the 'less than' type.
Scale:
On x-axis unit 1 cm = Rs. 10
and on y-axis 1 cm = 5 workers
Question 2.
During the medical check-up of 35 students in a class, their weights were recorded as follows:
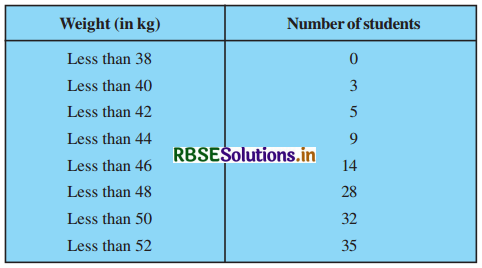
Draw a less than type ogive for the given data. Hence obtain the median weight from the graph and verify the result by using the formula.
Solution:
Distribution of ‘less than’ type
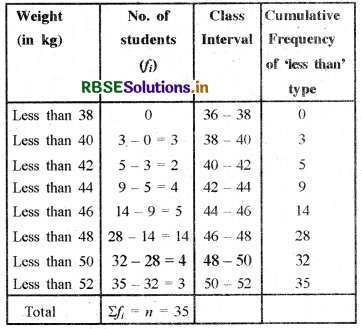
Now, we plot the points i.e., A(38, 0); B(40, 3); C(42, 5); D(44, 9); E(46, 14); F(48, 28); G(50, 32); H(52, 35) on a graph paper and join them by a free hand smooth curve to get cumulative frequency curve. Hence ABCDEFGH is the required ogive.
Scale:
on x-axis 1 cm = 2 kg
and on y-axis 1 cm = 5 students
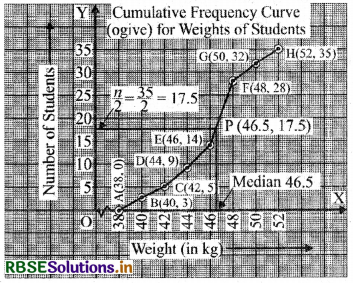
From the above graph, it is clear that the Median = 46.5 kg which lies in the interval 46-48.
Now, according to the given table
Σfi = n = 35
Then, \(\frac{n}{2}=\frac{35}{2}\) = 17.5, which lies in the interval 46-48.
∴ Median Class = 46 - 48
So, l = 46; n = 35; f = 14; cf = 14 and h = 2
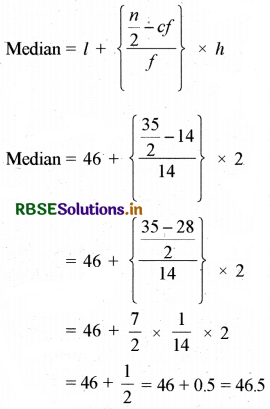
From the above graph, it is clear that in both cases the median is the same.
Hence, the median weight of the students is 46.5 kg.

Question 3.
The following table gives the production yield per hectare of wheat of 100 farms in a village.
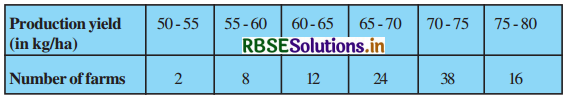
Change the distribution to a more than type distribution, and draw its ogive.
Solution:
To Convert the given distribution into the distribution of ‘more than’ type
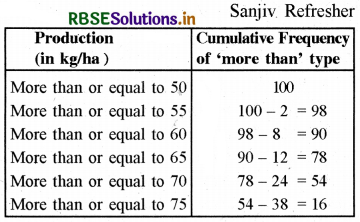
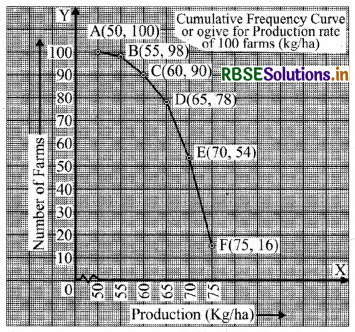
Now, we plot the points, i.e., A(50, 100); B(55, 98); C(60, 90); D(65, 78); E(70, 54); F(75, 16) on a graph paper.
We get the graph of the cumulating frequency of the 'more than type.
Hence ABCDEF is the required ogive.
Scale:
on x-axis is 1 cm = 5 kg/ha
and on y-axis is 1 cm = 10 farms

- RBSE Solutions for Class 10 Maths Chapter 6 त्रिभुज Ex 6.3
- RBSE Solutions for Class 10 Maths Chapter 9 त्रिकोणमिति के कुछ अनुप्रयोग Ex 9.1
- RBSE Solutions for Class 10 Maths Chapter 11 रचनाएँ Ex 11.2
- RBSE Solutions for Class 10 Maths Chapter 11 रचनाएँ Ex 11.1
- RBSE Solutions for Class 10 Maths Chapter 8 त्रिकोणमिति का परिचय Ex 8.1
- RBSE Solutions for Class 10 Maths Chapter 7 निर्देशांक ज्यामिति Ex 7.1
- RBSE Solutions for Class 10 Maths Chapter 14 सांख्यिकी Ex 14.3
- RBSE Solutions for Class 10 Maths in Hindi Medium & English Medium
- RBSE Solutions for Class 10 Maths Chapter 15 प्रायिकता Ex 15.2
- RBSE Solutions for Class 10 Maths Chapter 15 प्रायिकता Ex 15.1
- RBSE Solutions for Class 10 Maths Chapter 14 सांख्यिकी Ex 14.4