RBSE Solutions for Class 10 Maths Chapter 14 Statistics Ex 14.2
Rajasthan Board RBSE Solutions for Class 10 Maths Chapter 14 Statistics Ex 14.2 Textbook Exercise Questions and Answers.
Rajasthan Board RBSE Solutions for Class 10 Maths in Hindi Medium & English Medium are part of RBSE Solutions for Class 10. Students can also read RBSE Class 10 Maths Important Questions for exam preparation. Students can also go through RBSE Class 10 Maths Notes to understand and remember the concepts easily. Make use of our handy algebraic arithmetic sequences calculator and find the Sum of n terms of the arithmetic sequence.
RBSE Class 10 Maths Solutions Chapter 14 Statistics Ex 14.2
Question 1.
The following table shows the ages of the patients admitted to a hospital during a year:
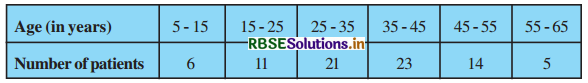
Find the mode and the mean of the data given above. Compare and interpret the two measures of central tendency.
Solution:
For Mode:
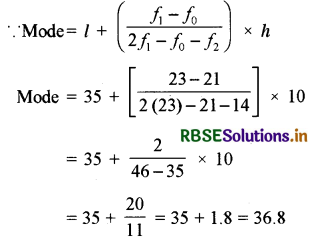
In the given data, the maximum frequency is 23 and the corresponding class interval to it is 35-45.
∴ Modal Class = 35 - 45
So l = 35; f1 = 23; f0 = 21; f2 = 14 and h = 10
For Mean:
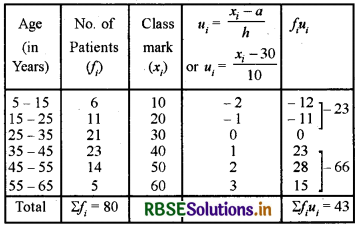
Here, Assumed Mean (a) = 30
Class Size (h) = 10
∴ \(\bar{u}=\frac{\sum f_{i} u_{i}}{\sum f_{i}}=\frac{43}{80}\) = 0.5375
∵ Mean \((\overline{\mathrm{X}})=a+h \bar{u}\)
= 30 + 10(0.5375)
= 30 + 5.375
= 35.375
= 35.37
Hence, the mode of the given data is 36.8 years and the mean of the given data is 35.37 years.
Also, from the above discussion, it is clear that the mean age of the patients admitted to a hospital is 35.37 years and the age of the maximum number of patients admitted to a hospital is 36.8 years.

Question 2.
The following data gives the information on the observed lifetimes (in hours) of 225 electrical components:
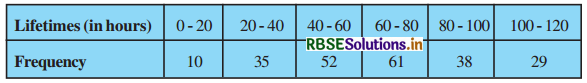
Determine the modal lifetimes of the components.
Solution:
In the given data, the maximum frequency is 61 and its corresponding class interval is 60-80.
∴ Modal Class = 60 - 80
So l = 60; f1 = 61; f0 = 52; f2 = 38 and h = 20
∵ Mode = \(l+\left(\frac{f_{1}-f_{0}}{2 f_{1}-f_{0}-f_{2}}\right) \times h\)
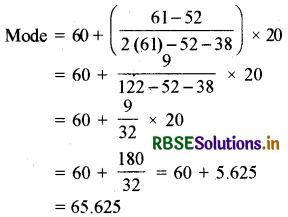
Hence, the modal lifetime of the components is 65.625 hours.
Question 3.
The following data gives the distribution of the total monthly household expenditure of 200 families in a village. Find the modal monthly expenditure of the families. Also, find the mean monthly expenditure:
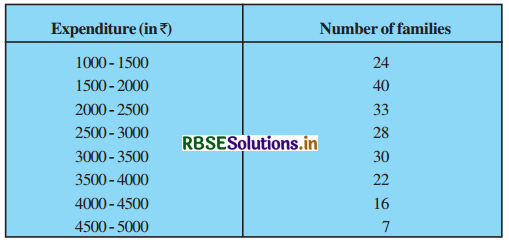
Solution:
For Mode:
In the given data the maximum frequency is 40 and the class corresponding to this frequency is 1500-2000.
∴ Modal Class = 1500 - 2000
So l = 1500; f1 = 40; f0 = 24; f2 = 33 and h = 500
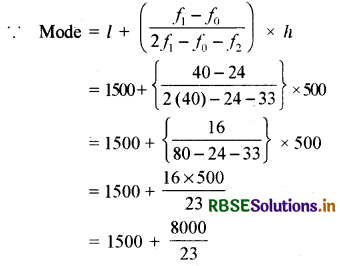
= 1500 + 347.83
= 1847.83
Hence Mode = 1847.83
For Mean:
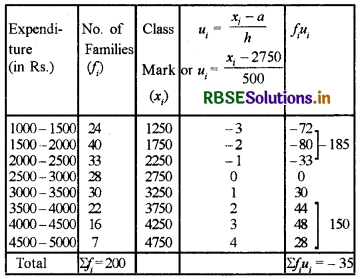
Here, Assumed Mean (a) = 2750
and Class Size (h) = 500
∴ \(\bar{u}=\frac{\sum f_{i} u_{i}}{\sum f_{i}}=-\frac{35}{200}\) = -0.175
∵ Mean \((\overline{\mathrm{X}})=a+h \bar{u}\)
= 2750 + 500(-0.175)
= 2750 - 87.50
= 2662.50
Hence the modal monthly expenditure of the families is Rs. 1847.83 and the mean monthly expenditure is Rs. 2662.50.
Question 4.
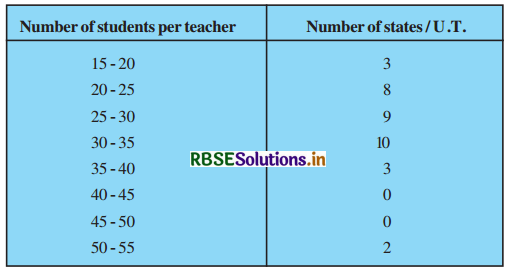
The following distribution gives the state-wise teacher-student ratio in higher secondary schools in India. Find the mode and mean of this data. Interpret the two measures.
Solution:
For Mode:
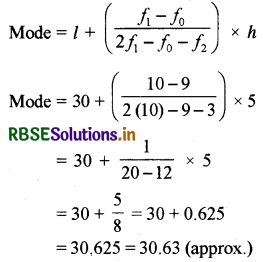
In the given data the maximum frequency is 10 and the class interval corresponding to it is 30-35.
∴ Modal Class = 30 - 35
So l = 30; f1 = 10; f0 = 9; f2 = 3 and h = 5
For Mean:
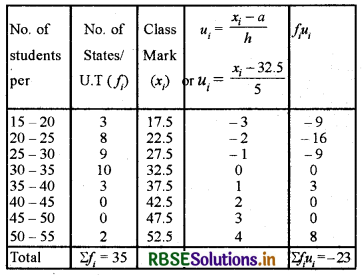
Here Assumed Mean (a) = 32.5
and Class Size (h) = 5
∴ \(\bar{u}=\frac{\sum f_{i} u_{i}}{\sum f_{t}}=-\frac{23}{35}\) = -0.657
∵ Mean \((\overline{\mathrm{X}})=a+h \bar{u}\)
= 32.5 + 5 (-0.657)
= 32.5 - 3.285
= 29.215 (approx.)
Hence the mode and median of the given data are 30.63 and 29.215. Also, from above it is clear that in State/U.T.
the number of students per teacher is 30.63 and according to average, this ratio is 29.215.
Question 5.
The given distribution shows the number of runs scored by some top batsmen of the world in one-day international cricket matches.
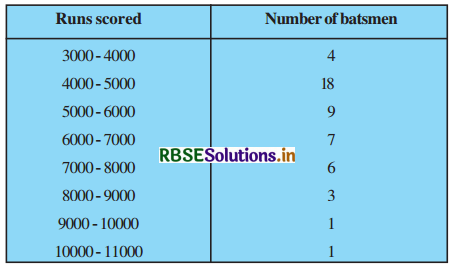
Find the mode of the data.
Solution:
In the given data, the maximum frequency is 18 and the class-interval corresponding to it is 4000 - 5000.
∴ Modal Class = 4000 - 5000
So l = 4000; f1 = 18; f0 = 4; f2 = 9 and h = 1000

Hence the mode of the given data is 4608.7 runs.
Question 6.
A student noted the number of cars passing through a spot on a road for 100 periods each of 3 minutes and summarised it in the table given below. Find the mode of the data:
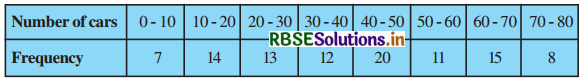
Solution:
In the given data, the maximum frequency is 20 and its corresponding class interval is 40-50.
∴ Modal Class = 40 - 50
So l = 40; f1 = 20; f0 = 12; f2 = 11 and h = 10
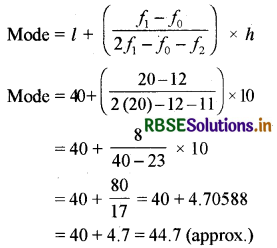
Hence, the mode of the given data is 44.7 cars.

- RBSE Solutions for Class 10 Maths Chapter 6 त्रिभुज Ex 6.3
- RBSE Solutions for Class 10 Maths Chapter 9 त्रिकोणमिति के कुछ अनुप्रयोग Ex 9.1
- RBSE Solutions for Class 10 Maths Chapter 11 रचनाएँ Ex 11.2
- RBSE Solutions for Class 10 Maths Chapter 11 रचनाएँ Ex 11.1
- RBSE Solutions for Class 10 Maths Chapter 8 त्रिकोणमिति का परिचय Ex 8.1
- RBSE Solutions for Class 10 Maths Chapter 7 निर्देशांक ज्यामिति Ex 7.1
- RBSE Solutions for Class 10 Maths Chapter 14 सांख्यिकी Ex 14.3
- RBSE Solutions for Class 10 Maths in Hindi Medium & English Medium
- RBSE Solutions for Class 10 Maths Chapter 15 प्रायिकता Ex 15.2
- RBSE Solutions for Class 10 Maths Chapter 15 प्रायिकता Ex 15.1
- RBSE Solutions for Class 10 Maths Chapter 14 सांख्यिकी Ex 14.4