RBSE Solutions for Class 8 Maths Chapter 5 Data Handling Ex 5.1
Rajasthan Board RBSE Solutions for Class 8 Maths Chapter 5 Data Handling Ex 5.1 Textbook Exercise Questions and Answers.
Rajasthan Board RBSE Solutions for Class 8 Maths in Hindi Medium & English Medium are part of RBSE Solutions for Class 8. Students can also read RBSE Class 8 Maths Important Questions for exam preparation. Students can also go through RBSE Class 8 Maths Notes to understand and remember the concepts easily. Practicing the class 8 maths chapter 6 try these solutions will help students analyse their level of preparation.
RBSE Class 8 Maths Solutions Chapter 5 Data Handling Ex 5.1
Question 1.
For which of these would you use a histogram to show the data?
(a) The number of letters for different areas in a postman’s bag.
(b) The height of competitors in an athletics meet.
(c) The number of cassettes produced by 5 companies.
(d) The number of passengers boarding trains from 7:00 a.m. to 7:00 p.m. at a station.
Give reasons for each.
Answer:
In (b) and (d), we use a histogram to show the data because here data can be divided into class intervals.

Question 2.
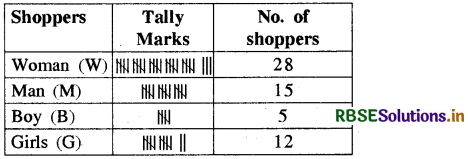
The shoppers who come to a departmental store are marked as: man (M), woman (W), boy (B) or girl (G). The following list gives the shoppers who came during the first hour in the morning
W W W G B W W M G G M M W W W W G B M W B G G M W W M M W W W M W B W G M W W W W G W M M W W M W G W M G W M M B G G W
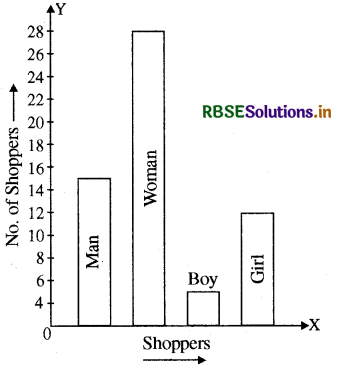
Make a frequency distribution table using tally marks. Draw a bar graph to illustrate it.
Answer:
We arrange the data in a table using tally marks as below:
The bar graph of the above data is as below
Question 3.
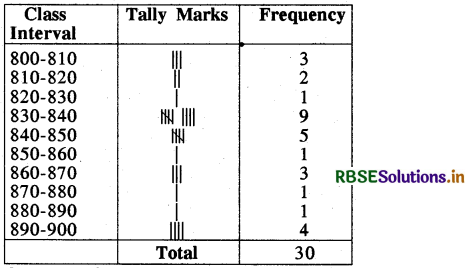
The weekly wages (in Rs) of 30 workers in a factory are.
830, 835, 890, 810, 835, 836, 869, 845, 898, 890, 820, 860, 832, 833, 855, 845,
804, 808, 812, 840, 885, 835, 835, 836, 878, 840, 868, 890, 806, 840
Using tally marks make a frequency table with intervals as 800-810, 810-820 and so on.
Answer:
We make a grouped frequency table as below
Question 4.
Draw a histogram for the frequency table made for the data in Question 3, and answer the following questions.
(i) Which group has the maximum number of workers?
(ii) How many workers earn Rs 850 and more?
(iii) How many workers earn less than Rs 850?
Answer:
The histogram to the datas of question 3 is given below
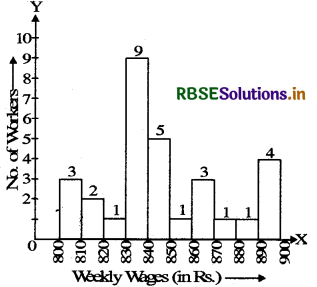
It is clear from die above histogram that:
(i) The group 830-840 has the maximum number of workers.
(ii) No. of workers who earn ₹ 850 and more are 1 + 3 + 1 + 1 + 4, i.e. 10.
(iii) The number of workers who earn less than ₹ 850 are 3 + 2 + 1 + 9 + 5, i.e. 20
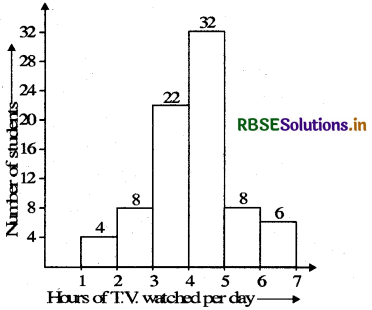
Question 5.
The number of hours for which students of a particular class watched television during
holidays is shown through the given graph.
Answer the following.
(i) For how many hours did the maximum number of students watch TV?
(ii) How many students watched TV for less than 4 hours?
(iii) How many students spent more than 5 hours in watching TV?
Answer:
From given histogram, it is clear that
(i) The maximum number of students watch TV for 4-5 hours.
(ii) The number of students who watch TV for less than 4 hours are 4 + 8 + 22 = 34
(iii) The number of students who spend more than 5 hours in watching TV are 8 + 6 = 14

- RBSE Solutions for Class 8 Maths Chapter 11 क्षेत्रमिति Ex 11.3
- RBSE Solutions for Class 8 Maths Chapter 2 एक चर वाले रैखिक समीकरण Ex 2.4
- RBSE Solutions for Class 8 Maths Chapter 6 Square and Square Roots Intext Questions
- RBSE Solutions for Class 8 Maths Chapter 11 क्षेत्रमिति Ex 11.2
- RBSE Solutions for Class 8 Maths Chapter 6 वर्ग और वर्गमूल Ex 6.2
- RBSE Solutions for Class 8 Maths Chapter 3 चतुर्भुजों को समझना Ex 3.2
- RBSE Solutions for Class 8 Maths Chapter 5 Data Handling Intext Questions
- RBSE Solutions for Class 8 Maths Chapter 11 Mensuration Intext Questions
- RBSE Solutions for Class 8 Maths Chapter 2 एक चर वाले रैखिक समीकरण Ex 2.5
- RBSE Solutions for Class 8 Maths Chapter 8 Comparing Quantities Intext Questions
- RBSE Solutions for Class 8 Maths Chapter 7 घन और घनमूल Ex 7.2