RBSE Class 8 Maths Important Questions Chapter 15 Introduction to Graphs
Rajasthan Board RBSE Class 8 Maths Important Questions Chapter 15 Introduction to Graphs Important Questions and Answers.
Rajasthan Board RBSE Solutions for Class 8 Maths in Hindi Medium & English Medium are part of RBSE Solutions for Class 8. Students can also read RBSE Class 8 Maths Important Questions for exam preparation. Students can also go through RBSE Class 8 Maths Notes to understand and remember the concepts easily. Practicing the class 8 maths chapter 6 try these solutions will help students analyse their level of preparation.
RBSE Class 8 Maths Chapter 15 Important Questions Introduction to Graphs
Multiple Choice Questions:
Question 1.
In a line graph, the independent variable is plotted along the:
(a) x-axis
(b) y-axis
(c) on xv-plane
(d) independent variable is not represented
Answer:
(a) x-axis
Question 2.
The best graph for data with regular interval is:
(a) bar graph
(b) pie chart
(c) histogram
(d) none of the above
Answer:
(c) histogram
Question 3.
As per the given line graph, the growth rate in the year 1994 was
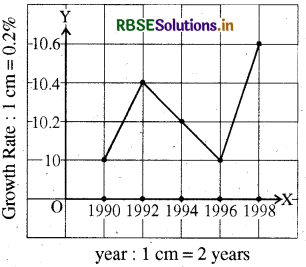
(a) 10%
(b) 10.2%
(c) 10.4%
(d) 10.6%
Answer:
(b) 10.2%
Fill in the blanks:
Question 1.
Horizontal line is also known as ___________
Answer:
x-axis
Question 2.
___________ line is also known as y-axis.
Answer:
Vertical
Question 3.
A complete continuous line graph is called a ___________
Answer:
linear graph

Question 4.
A graph represents the relation between an independent variable and a ___________
Answer:
dependent variable.
Very Short Answer Type Questions:
Question 1.
What is the main objective behind the representation of numerical facts through graphs?
Answer:
The main objective behind the representation of numerical facts through graphs is to present the data through pictures so that they can be easily, quickly and clearly understandable.
Question 2.
When are pie charts best to use?
Answer:
Pie charts are best to use when comparison between different parts of a whole is required.
Question 3.
The given graph represents the selection of 12th pass students of a senior secondary school in National Talent Hunt program. In which year, the selection was equal?
Answer:
In 1997 and 1999.
Question 4.
What do you mean by cartesian system?
Answer;
The system of fixing a point with the help of two measurements, vertical and horizontal, came to known as cartesian system.
Essay Type Questions:
Question 1.
The numbers of the students of class VI to X of a school are given in the following table.
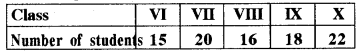
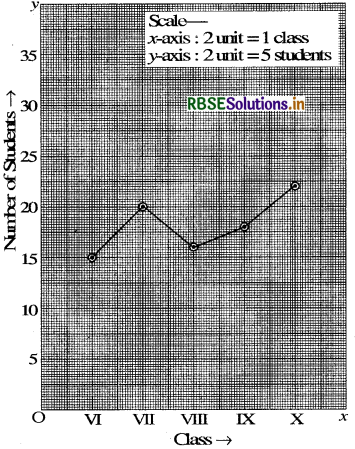
By taking appropriate scale draw a line graph.
Answer:
To draw the required graph, we represent class on the x-axis and the number of students on the y-axis. We plot the ordered pairs (VI, 15), (VII, 20), (VIII, 16), (IX, 18) and (X, 22) as points and then join them by line segments as shown below.

- RBSE Solutions for Class 8 Maths Chapter 11 क्षेत्रमिति Ex 11.3
- RBSE Solutions for Class 8 Maths Chapter 2 एक चर वाले रैखिक समीकरण Ex 2.4
- RBSE Solutions for Class 8 Maths Chapter 6 Square and Square Roots Intext Questions
- RBSE Solutions for Class 8 Maths Chapter 11 क्षेत्रमिति Ex 11.2
- RBSE Solutions for Class 8 Maths Chapter 6 वर्ग और वर्गमूल Ex 6.2
- RBSE Solutions for Class 8 Maths Chapter 3 चतुर्भुजों को समझना Ex 3.2
- RBSE Solutions for Class 8 Maths Chapter 5 Data Handling Intext Questions
- RBSE Solutions for Class 8 Maths Chapter 11 Mensuration Intext Questions
- RBSE Solutions for Class 8 Maths Chapter 2 एक चर वाले रैखिक समीकरण Ex 2.5
- RBSE Solutions for Class 8 Maths Chapter 8 Comparing Quantities Intext Questions
- RBSE Solutions for Class 8 Maths Chapter 7 घन और घनमूल Ex 7.2