RBSE Class 11 Maths Notes Chapter 15 Statistics
These comprehensive RBSE Class 11 Maths Notes Chapter 15 Statistics will give a brief overview of all the concepts.
Rajasthan Board RBSE Solutions for Class 11 Maths in Hindi Medium & English Medium are part of RBSE Solutions for Class 11. Students can also read RBSE Class 11 Maths Important Questions for exam preparation. Students can also go through RBSE Class 11 Maths Notes to understand and remember the concepts easily.
RBSE Class 11 Maths Chapter 15 Notes Statistics
Introduction:
In earlier classes, we have studied methods of representing data graphically and in tabular form. This representation reveals certain salient features or characteristics of the data. We have also studied the methods of finding a representative value for the given data. This value is called the measure of central tendency (Mean, Median and Mqde).
Measures of Dispersion:
In process to draw results by analysing the statistical facts, measures of central tendency are not sufficient. By central tendency we know the central value of series which represents the series. But the central values are inadequate to gives us a complete idea of the distiibution as they do not tell us the extent to which the observations vary from the central value.
For example:
Following data represents the marks obtained by students of two sections of same class (Max. Marks 20):
1, 2, 3, 4, 6, 7, 8, 10, 19, 20 .
and 4, 5, 5, 7, 8, 8, 9, 10, 11, 13
Here, Arithmetic Mean
(i) \(\frac{1+2+3+4+6+7+8+10+19+20}{10}=\frac{80}{10}\) = 8
(ii) \(\frac{4+5+5+7+8+8+9+10+11+13}{10}=\frac{80}{10}\) = 8
Here A.M. of two data are same but mean difference we can say that in section 1, maximum students are weak and few are good whereas in section two there are average students. This variation of data is called dispersion.
The dispersion is the measure of variations in the values of the variable. It measures the degree of scatteredness of the observations in a distribution around the central value.
Generally, in statistics following measures of dispersion are used:
1. Range
2. Quartile deviation
3. Mean deviation
4. Standard deviation and variance
Note: In this chapter Quartile deviation will not be discussed.

Range:
The difference between the highest value (H) and the lowest value (L) of a given set of data is called range (R).
Thus, R = H - L
More value of range shows more dispersion and vice-versa.
Demerits of Range:
(1) It is unstable measure of dispersion.
(2) It cannot tells about form of suits.
(3) It is not a scientific measure.
Deviation: Deviation of constant A from any observation x is represented as (x - A).
A may be arithmetic mean or median. It is denoted by d also. Deviation d - (x - A)
If x < A, then deviation will be negative (-ve) and if x > A then deviation will be positive (+ve).
Mean Deviation
When, we find the dispersion of values x from a central value ‘a’, we find the deviations about a. An absolute measure of dispersion is the mean of these deviations, i.e., Mean deviation about a central value (mean, median and mode) is the mean of the absolute values of the deviations of the observations from central value.
While calculating each deviation is taken as positive. Positive and Negative signs are not marked.
Mean Deviation for Ungrouped Data
Let n observations be x1, x2, x3,... xn, then their mean deviation (M.D.) can be find by taking deviations by two ways:
(1) Mean deviation about mean
(2) Mean deviation about median
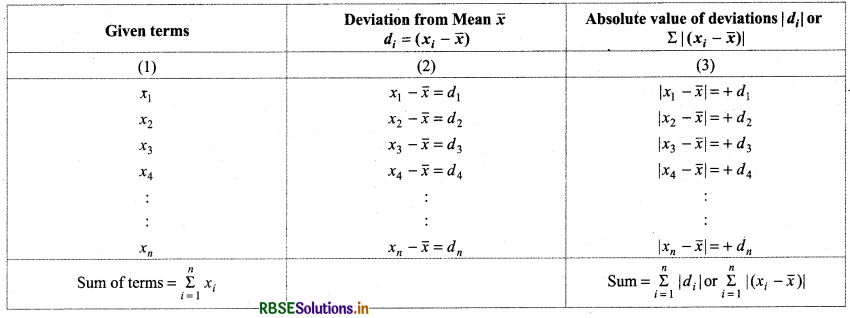
(1) Mean deviation with respect to Mean: Working method ta find mean deviation about mean:
(i) First, prepare calculation table for mean deviation.
(ii) Mark the data in first column of table and find their sum which is denoted by \(\sum_{i=1}^n\) xi
(iii) Then calculate x by mean (Arithmetic) formula x̄ = \(\frac{\sum_{i=1}^n x_i}{n}\)
(iv) Now, second column of table, find deviation of each xi, di = (xi - x̄) w.r.t. mean x̄.
(v) Then, in third column of table, write absolute value of obtained deviations corresponding to each observation (xi - x̄),
|di| or |xi - x̄| and find their sum \(\sum_{i=1}^n\)|di| or \(\sum_{i=1}^n\) |(xi - x̄)|
(vi) In last, by using formula of mean diviation (M.D.), we get required result.
M.D. = \(\frac{\sum_{i=1}^n\left|\left(x_i-\bar{x}\right)\right|}{x}\) or M.D. = \(\frac{\sum_{i=1}^n\left|d_i\right|}{n}\)
Calculation table for mean deviation:
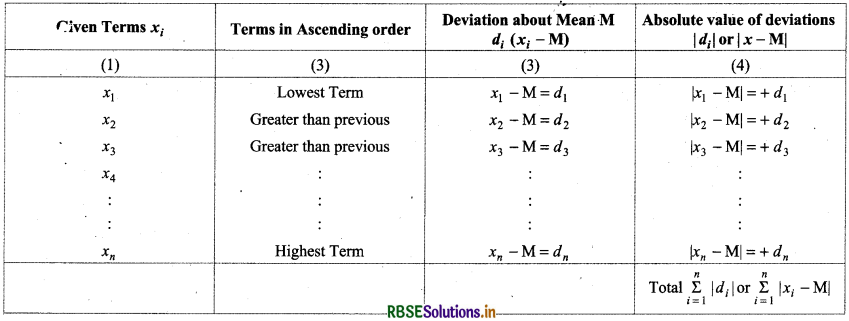
 (2) Mean deviation with respect to Median: Working method to find mean deviation with respect to median:
(i) First, prepare calculation table to find mean deviation.
(ii) In first column of table, mark the data.
(iii) In second column of table, arrange the data in ascending order then find median.
When n is odd,
Median (M) = Value of \(\left(\frac{n+1}{2}\right)\)th term
When n is even,
Median (M) = A.M of \(\left(\frac{n}{2}\right) \)and \(\left(\frac{n}{2}+1\right)\) th term values
i.e., M = \(\frac{\left(\frac{n}{2}\right) \text { th term }+\left(\frac{n}{2}+1\right) \text { th term }}{2}\)
(iv) In third column of table, write deviation di or (xi - M) of each term (xi) with respect to median M.
(v) In fourth column of table, find the absolute value of deviations of variable about median, di or (xi - M) and then find the sum of these deviations i.e.,
\(\sum_{i=1}^n\)|di| or \(\sum_{i=1}^n\)|xi - M|
(vi) Now, calculate mean deviation by using the formula
M.D = \(\frac{\sum_{i=1}^n\left|x_i-\mathrm{M}\right|}{n}\) or M.D = \(\frac{\sum_{i=1}^n\left|d_i\right|}{n}\)
Calculation table to find mean deviation about median:
 Mean Deviation from Grouped Data
Data can be classified by two ways:
(1) Discrete frequency distribution
(2) Continuous frequency distribution
(1) Mean deviation for discrete frequency distribution:Let f1, f2, f3, ....... fn are frequencies of given data x1, x2, x3, ..., xn. Its frequency distribution will be as follows:
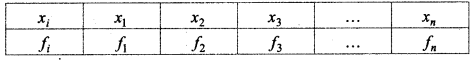
(i) Mean deviation about Mean: Mean of above date = x̄ = \(\frac{\sum_{i=1}^n f_i x_i}{\sum_{i=1}^n f_i}=\frac{1}{N}\) fixi, , where N = \(\sum_{i=1}^n\) fi,
Calculation Table
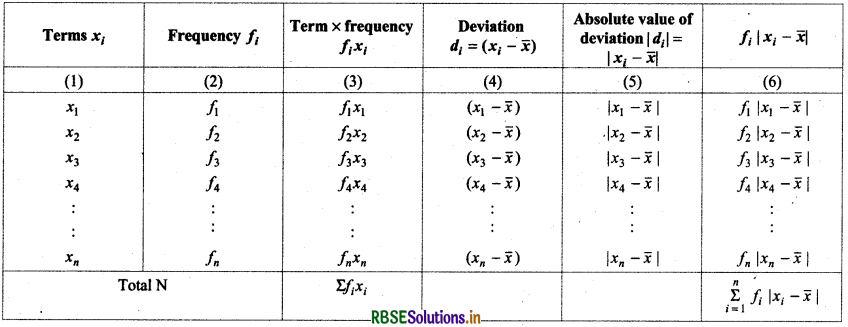 Mean Deviation (M.D) = \(\frac{\sum_{i=1}^n f_i\left|x_i-\bar{x}\right|}{N}\)
Mean deviation about Median:
To find mean deviation about median, we find the median of the given discrete frequency distribution. For this the observations are arranged in ascending order. After this the cumulative frequencies are obtained. Then, we idendify the observation whose cumulative frequency is equal to or just greater than \(\frac{N}{2}\), where N is the sum of frequencies. This value of the observation lies in the middle of the data. Thus, it is the required median. After finding median, we obtain the mean of the absolute values of the observations from median. Thus,
M.D.(M) = \(\frac{1}{N} \sum_{i=1}^n\) fi|xi - M|
2. Mean Deviation for Continuous Frequency Distribution:
(a) Mean deviation about mean: When given data is classified in different groups of without difference, then it is called continuous frequency distribution.
Let frequencies of defferent groups l1 - l2, l2 - l3, l3 - l4, .................. ln-1 - ln, n are respectively f1, f2, f3, f4, .................... fn
Table to compute mean deviation from mean is given below.
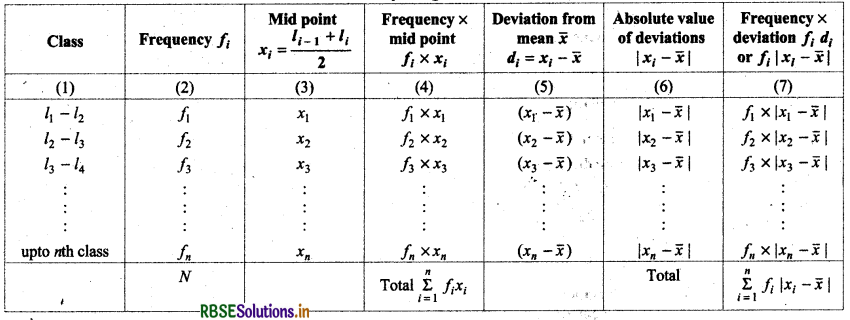 Mean (x̄) = \(\frac{\sum_{i=1}^n f_i x_i}{N}\)
Mean Deviation (M.D) = \(\frac{\sum_{i=1}^n f_i\left|x_i-\bar{x}\right|}{N}\)
Limitations of Mean Deviation:
- In mean deviation, algebraic signs are ignored which is mathematically wrong.
- It changes according to the size of demonstration.
- It is indefinite and incomparable.
- Its algebraic use is not possible.
Variance and Standard Deviation
While calculating mean deviation about mean or median, the absolute values of the deviations were taken.
The absolute values were taken to give meaning to the mean deviation, otherwise the deviations may cancel among themselves.
Standard Deviation
The square root of arithmetic mean of squares of deviations obtained from arithmetic mean of various variable values of a series is called standard deviations.
It is denoted by symbol a (sigma).
Let x1, x2, x3 ....... xn are given data, then their standard deviation can be calculated in the following manner :
- First Arithmetic Mean of given data is calculated.
- After this, deviations from mean are collected then squaring the deviations. Mean of these square deviation is standard deviation.
- For grouped data, square of deviations are multiplied by corresponding frequencies and then find their sum if deviation is di and corresponding frequency is f, then find Σfid2i.
- Again, divide this sum by N (sum of frequencies) and get square root of quotient. This square root is the required standard deviation (a).
Variable Formulae of Standard Deviation:
(1) When data Is ungrouped : If x1, x2, x3 ....... xn are given data, then:
Standard deviation = \(\frac{\sum_{i=1}^n(x-\bar{x})^2}{N}\) or \(\frac{\sum_{i=1}^n d_i^2}{N}\)
where x̄ = Arithmetic mean
xi = x̄ = Deviation from arithmetic mean
and N = number of data
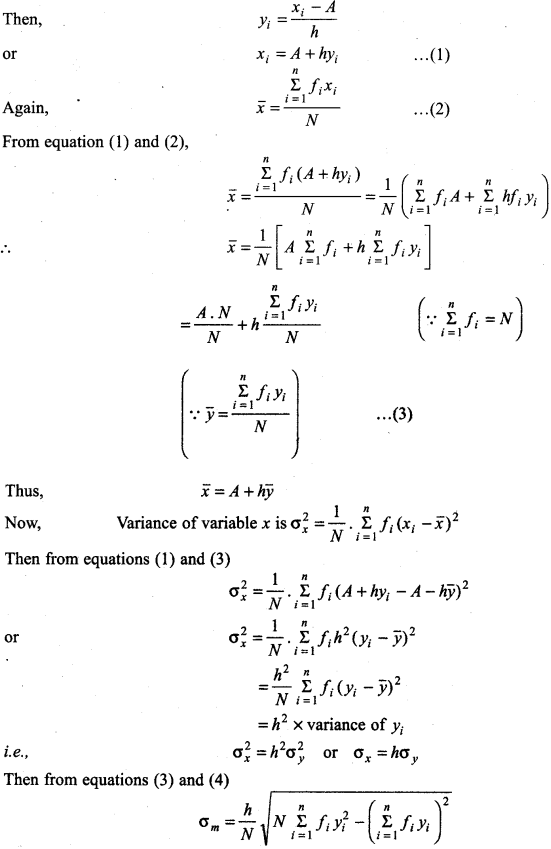
(2) When data is classified: Let assumed mean is A, then yi = \(\frac{\left(x_i-A\right)}{h}\)
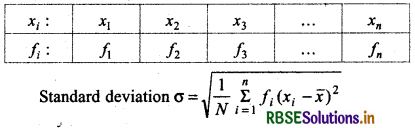
Standard Deviation of Discrete Frequency Distribution:
If given discrete frequency distribution
Standard Deviation of a Continuous Frequency Distribution:
First take mid point of all classes of given continuous frequency distribution and convert into discrete frequency distribution. Then the standard deviation is calculated by the method adopted in the case of a discrete frequency distribution.
If frequency distribution is of the following type:
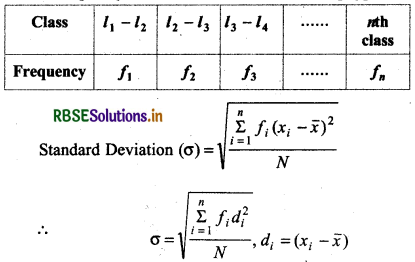
and xi is mid point of corresponding class N = \(\sum_{i=1}^n\)fi
Another Formula for Standard Deviation:
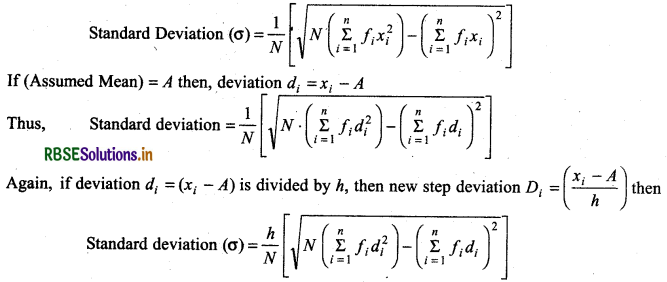
In brief, standard deviation is denoted by S.D.
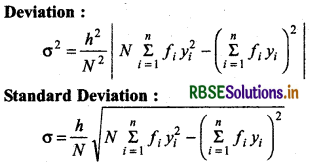
Variance: Mean of the squares of the deviations from mean is called the ‘variance’ and is denoted by σ2
(Variance) = (Standard Deviation)2
Note:
- If all observations are multiplied by n then variance will be n times the original variance.
- If n is added or subtracted in each observations then variance remains unchanged.
Shortcut Method to Find Variance and Standard Deviation:
Sometimes the values of xi in a discrete distribution or the mid points xi of different classes is a continuous distribution are large and so the calculation of mean and variance becomes tedious and time consuming. By using step-deviation method, it is possible to simplify the procedure.
Let the assumed mean be ‘A’ and the scale be reduced to \(\frac{1}{n}\) times (n being the width of class-intervals).
Let the step deviations or the new values by yi.
Using this formula we can find variance and standard deviation by short-cut method.
Analysis of Frequency Distributions:
In earlier sections, we have studied about some types of measures of dispersion. The mean deviation and the standard deviation have the same units in which the data are given. Wherever we want to compare the variability of two series with same mean, which are measured in different units, we do not merely calculate the measures of dispersion but we require such measures which are independent of the units.
The measure of variability which is independent of units is called coefficient of variation and is denoted by C.V.
The coefficient of variation is defined as:
C.V = \(\frac{\sigma}{\bar{x}}\) × 100, x̄ ≠ 0
where σ and x̄ are the standard deviation and mean of the data.
For comparing the variability or dispersion of two series, we calculate the coefficient of variance for each series. The series having greater C.V is said to be more variable than the other. The series having lesser C.V is said to be more consistent than the other.
Comparison of Two Frequency Distributions with Same Mean
Let x̄1 and σ1 be the mean and standard deviation of the first distribution, and x̄2 and σ2 be the mean and standard deviation of the second distribution.
Then, C.V. (for Ist distribution) = \(\frac{\sigma_1}{\bar{x}_1}\) × 100
and C.V. (for IInd distribution) = \(\frac{\sigma_1}{\bar{x}_1}\) × 100
Given x̄1 = x̄2 = x̄ (say), then
C.V. (Ist distribution) = \(\frac{\sigma_1}{\bar{x}}\) × 100 .. .(i)
and CV (IInd distribution) = \(\frac{\sigma_1}{\bar{x}}\) × 100 ... (ii)
From equations (i) and (ii), it is clear that comparison of two C.V’s depends upon σ1 and σ2.
Thus, we say that for two series with equal means, the series with greater standard deviation (or variance) is called more variable or dispersed than the other.
Also the series with lesser value of standard deviation (or variance) is said to be more consistent than the other.
→ Dispersion: Dispersion is scatter from mean of variable values of a series.
→ Range: Difference in the maximum and minimum value of a senes is called range and range coefficient.
(C.R). = \(\frac{H-L}{H+L}\)
→ Mean Deviation : Mean deviation about a central value (mean, median, mode) is the mean of the absolute values of the deviations of the observations from central value.
(i) When data is grouped:
Mean deviation about A = \(\frac{\Sigma f_i\left|x_i-A\right|}{N}\), where A is statistical mean
(ii) For ungrouped frequency distribution:
Mean deviation A = \(\frac{1}{N}\)Σfi|xi - A|,where N = Σf
(iii) When data is grouped then above (ii) step is used.
Here xi is mid value of corresponding group.
→ Mean deviation coefficient = \(\frac{\text { Mean deviation }}{A}\) where A is that mean, from which mean deviation is taken.
→ Variance and Standard Deviation: Mean of square of deviations from mean is called variance. Positive square root of variance is called standard deviation.
(i) When data is ungrouped
Standard deviation
(σ) = \(\sqrt{\frac{\Sigma\left(x_i-\bar{x}\right)^2}{N}}=\sqrt{\frac{\Sigma x_i^2}{N}-\left(\frac{\Sigma x_i}{N}\right)^2}\)
(ii) When data is in the form of grouped or ungrouped frequency distiibution:
Σ = \(\sqrt{\frac{\Sigma f_i\left(x_i-\bar{x}\right)^2}{N}}=\sqrt{\frac{\Sigma f_i x_i^2}{N}-\left(\frac{\Sigma f_i x_i}{N}\right)^2}\)
→ Changining to Origin: 1f imaginary mean is a, then
(i) For ungrouped data, a = \(\sqrt{\frac{\Sigma d_i^2}{N}-\left(\frac{\Sigma d_i}{N}\right)^2}\) where
d = xi - a
(ii) For grouped or ungrouped frequency distribution
σ = \(\sqrt{\frac{\Sigma f_i d_i^2}{N}-\left(\frac{\Sigma f_i d_i}{N}\right)^2}\)
→ For Origin and Scale Change (step deviation): If imaginary mean is a and class interval of each class of grouped frequency is h, then taking ui = \(\frac{x_i-a}{h}\)
Standard deviation (σ) = \(\sqrt{\frac{\Sigma f_i u_i^2}{N}-\left(\frac{\Sigma f_i u_i}{N}\right)^2}\)
Coefficient of standard deviation = \(\frac{\Sigma}{\bar{x}}\)
Coefficient of variance = \(\frac{\sigma}{\bar{x}}\) × 100

- RBSE Solutions for Class 11 Maths Chapter 3 त्रिकोणमितीय फलन Ex 3.1
- RBSE Solutions for Class 11 Maths Chapter 2 संबंध एवं फलन विविध प्रश्नावली
- RBSE Solutions for Class 11 Maths Chapter 2 संबंध एवं फलन Ex 2.3
- RBSE Solutions for Class 11 Maths Chapter 2 संबंध एवं फलन Ex 2.2
- RBSE Solutions for Class 11 Maths Chapter 2 संबंध एवं फलन Ex 2.1
- RBSE Solutions for Class 11 Maths Chapter 1 समुच्चय विविध प्रश्नावली
- RBSE Solutions for Class 11 Maths Chapter 1 समुच्चय Ex 1.6
- RBSE Solutions for Class 11 Maths Chapter 1 समुच्चय Ex 1.5
- RBSE Solutions for Class 11 Maths Chapter 1 समुच्चय Ex 1.4
- RBSE Solutions for Class 11 Maths Chapter 1 समुच्चय Ex 1.3
- RBSE Solutions for Class 11 Maths Chapter 1 समुच्चय Ex 1.2