RBSE 11th Geography Practical Book Solutions Chapter Chapter 5 Topographical Maps
Rajasthan Board RBSE Solutions for Class 11 Geography Practical Book Chapter 5 Topographical Maps
Rajasthan Board RBSE Solutions for Class 11 Geography in Hindi Medium & English Medium are part of RBSE Solutions for Class 11. Students can also read RBSE Class 11 Geography Important Questions for exam preparation. Students can also go through RBSE Class 11 Geography Notes to understand and remember the concepts easily.
RBSE 11th Geography Practical Book Solutions Chapter 5 Topographical Maps
RBSE Class 11 Geography Topographical Maps Textbook Questions and Answers
1. Answer the following questions in about 30 words:
(i) What do you mean by Topographical Maps’?
Answer:
Topographical maps show the general topography of an area. These maps show the different features of physical and cultural environment. These are based on the actual survey of an area. These are generally large scale maps. Their scale is large enough to show the detailed map of an area. These maps show different relief features, rivers, vegetation, lakes etc. These also show various cultural features like roads, railways, towns, villages, (settlements), canals and other man-made features. In India, survey of India prepares topographical maps for all parts of the country on different scales.

(ii) Name the organisation which prepares the topographical maps of India.
Answer:
The Survey of India prepares the topographical maps of India.
(iii) Which are the commonly used scales for mapping our country used by the survey of India?
Answer:
The scales used by the survey of India: The scale which are commonly used for mapping are like 1:1000000, 1:25,0000, 1:50000 and 1:25000 by survey of India.
(iv) What are contours?
Answer:
Contours are imaginary lines which joins all places having the same height above mean sea level.
(v) What does the spacing of contours indicate?
Answer:
The vertical interval between two contours remains constant, the horizontal distance between the two varies place to place upon the nature of the slope. Contours are drawn different intervals such as 20, 50, 100 metres above the sea level it is spacing of contours.
(vi) What are conventional signs?
Answer:
Various symbols and letters are used to show the different features on the topographical maps. These symbols are known as conventional signs. These symbols generally represent the features as these are similar to these. It has become a general practice (convention) to use these symbols on topographical maps. So these are called conventional signs. Some features cannot be shown according to the scale of the map. These features are shown with the help of conventional signs. The use of conventional signs is to make the map informative and legible.
2. Write short note on:
(i) Contours
Answer:
Contour is the commonest, the most accurate and the most used method of showing relief. A contour is an imaginary line drawn on a map to join all the places of same height above meansea level. This height is shown by a figure written on the contour line. When the contours are close together, these show a steep-slope. But when the contours are wide apart, these show a gentle slope. The difference in the height between one contour and the next is called vertical interval (V.I.). The horizontal distance between two successive contours is called the horizontal equivalent (H.E.).
(ii) Marginal Information in Topographical sheets.
Answer:
The general information about the given Toposheet is as under:
- Name of the Toposheet: Ajmer (Pali and Udaipur districts)
- Number of Toposheet: 45
- Scale : 1" : 2 miles
- Latitudinal extent: 26°N latitude -to 26° 15' N
- Longitudinal extent: 74° 15' East to 74° 30' East
- Area: about 300 sq miles
- Year of Publication: Year 1953
- North: Magnetic North was W from True North.
- V.I.: 50 feet
- Year of Survey: 1929-30
(iii) The Survey of India
Answer:
The Survey of India is India’s central engineering agency in charge of mapping and surveying set up in 1767 to help consolidate the territeries of the British East India company. It is one of the oldest Engineering Departments of the Government of India. The Survey of India uses seven standard colours to depict the distributional pattern of land used on topographic patterns like Red colour, Yellow, Green, Blue, Black, Brown and Grey colours.
3. Explain what is meant by map interpretation and what procedure is followed for its interpretation.
Answer:
Description of features shown on map is only a prelude to map interpretation the letter involves a study of the factors that serve to explain the casual relationship among several features shown on a map. The procedure is followed in the common headings under which the map is interpreted are:
- Marginal Information
- Relief features
- Cultural features
1. Marginal Information: The information which are printed on the margins of the toposheets are called marginal information or Primary Information. There informations include:
- The number of sheet and name of the region.
- Extent of the region in latitues and longitudes.
- Directions
- The contour interval
- The key.
2. Relief features: To study the relief features of the given toposheet, we should take an eye survey of the entire area and make the various physical features depicted on the toposheet are to be printed out. the gap between is to be marked and average heights are to be measured.
(a) Drainage Pattern: To study the drainage patterns of the toposheet, the major rivers and their tributaries are to be noted. Their catchment area to be marked. U-shaped and V-shaped valleys are to be blentified.
(b) Natural Vegetation: With the careful study of the given toposheet, determine the types of forests and trees and mention whether they are evergreen deciduous, broad leave or coniferous. The distribution pattern of natural vegetation is also to be noted.
3. Cultural features: These features include the study of land use and occupation, transport and human settlements.
(a) The land use and occupation are not depicted on the toposheet, yet they can easily be deducted from the study of physical features depicted on the toposheet.
(b) Means of transport and communication: These can be easily studied with the help of the conventional symbols or the key of the toposheet.
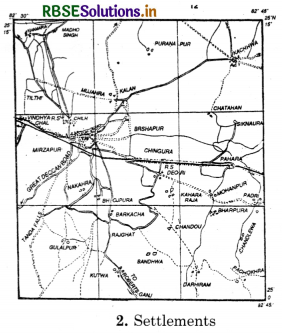
(c) Human Settlements: The study of human settlements through light on the land use and occupation of the people is done. The urban centre are to be noted. What are their size and for what are they famous. As concern the rural settlements, you have to note the distribution pattern of human settlements. They may be circular or scattered.
4. If you are interpreting cultural features of a topographical sheet, what information woulc you like to seek and how would you derive this information? Discuss with the help of suitable examples.
Answer:
The cultural features are the settlements like roads, railways and buildings. These features and their distribution pattern help in understanding the area. We will seek the information about these features. This information on means of transport and communication is sought from the given sheet through the question such as what are the means of transport in the region etc. Next information we will be derived about human settlements. This information also indicate the occupation, the land use etc. we will come to know that how many urban centres and industrial centres are there? How deuse are the rural settlement? Nucleated settlements with uniform distribution occur in relatively flat alluvial plains as in Uttar Pradesh. Along the coastal plains in Kerala we find linear pattern of settlements following old sand deuse parallel to the coast.
Exercise A
Study the contour pattern and answer the following questions.
Question 1.
Name the geographical feature formed by contours.
Answer:
Plateau is the geographical feature formed by the given contours.
Question 2.
Find out the contour interval in the map.
Answer:
The contour interval is 10 m.
Question 3.
Find out the map distance between E and F and convert it into ground distance.
Answer:
The map distance between E and F is 1.8 cm. The ground distance of E and F is 3.6 km (Scale 1cm = 2 km)
Question 4.
Name the type of slope between A and B, C and D and E and F.
Answer:
Slope between A and B is gentle, C and D is steep and E and F is gentle and convex.
Question 5.
Find out the direction of E, D and F from G.
Answer:
The direction of E is north-west, D is north and F is south-west.
Exercise B
Question 1.
Convert 1:50,000 into a statement scale.
Answer:
1:50,000 or 1cm = 50,000cm or 1 cm - 1.5 km (lcm =1, 00,000 km)
Question 2.
Name the major settlement of the area.
Answer:
Kachhwa is the major settlement of the area.
Question 3.
What is the direction of flow of the river Ganga?
Answer:
The river Ganga is flowing from the northwest to southeast direction.
Question 4.
At which one of the banks of river Ganga, Bhatauli is located?
Answer:
Bhatauli is located on the right bank of river Ganga.
Question 5.
What is the pattern of rural settlement along the right bank of river Ganga?
Answer:
The settlement pattern in the right bank is scattered.
Question 6.
Name the villages/settlements where Post Office is located?
Answer: Post Office is located in Bhatauli, Upadhia, Prem ka Pura, Baroini.
Question 7.
What does the yellow colour in the area refer to?
Answer:
Yellow colour represents cultivated area.
Question 8.
What means of transportation is used to cross the river by the people of Bhatauli village?
Answer:
Ferry boats are the means of transportation used to cross the river by the people of Bhatauli village.
Exercise C
Study the extract from the topographical sheet 63K/12 shown in the figure on page 68 and answer the following questions.
Question 1.
Give the height of the highest point of the map.
Answer:
208 m (spot height) is the highest point of the map.
Question 2.
River Jamtihwa Nadi is flowing through which quarter of the map?
Answer:
River Jamtihwa Nadi is flowing through southeast quarter of the map.
Question 3.
Which is the major settlement located in the east of the Kuardari Nala?
Answer:
Danti is the major settlement located in the east of the Kuardari Nala.
Question 4.
What type of settlement does the area have?
Answer:
The area has linear type of settlement.
Question 5.
Name the geographical feature represented by white patches in the middle of Sipu Nadi.
Answer:
The geographical feature represented by white patches in the middle of Sipu Nadi is dry river channels.
Question 6.
Name the two types of vegetation shown on the part of the topographical sheet.
Answer:
Palmyra and Bamboo plantation are the two types of vegetation shown on the part of the topographical sheet.
Question 7.
What is the direction of flow of the |
Kuardari?
Answer:
The direction of flow of the Kuardari is north I to south.
Question 8.
In which part of the sheet area is Lower Khajuri Dam located?
Answer:
Lower Khajuri Dam is located in the southern part of the toposheet.
RBSE Class 11 Geography Topographical Maps Important Questions and Answers
Essay Type Questions
Question 1.
What colours are being used by the Survey of India department on topographic sheets?
Answer:
The Survey of India uses seven standard colours to depict the distributional pattern of land used on topographic sheets.
- Red Colour. For Buildings and Roads.
- Yellow Colour. For cultivated areas.
- Green Colour. For forests.
- Blue Colour. For water bodies.
- Black Colour. For lettering Boundaries and Railways.
- Brown Colour. For contours.
- Grey Colour. For hill-shading.
Question 2.
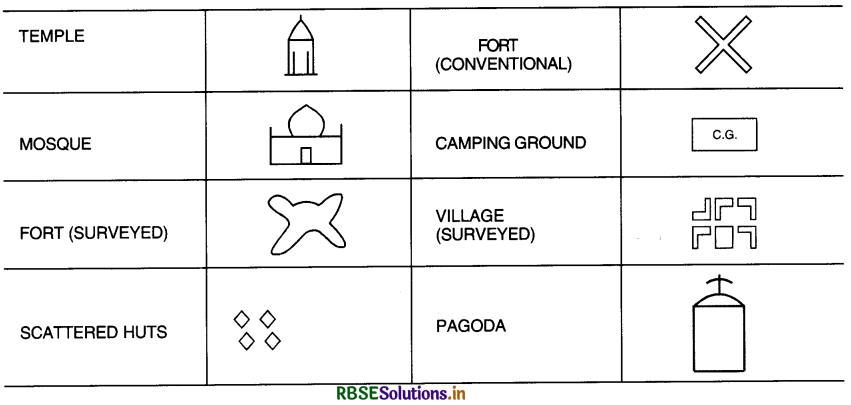
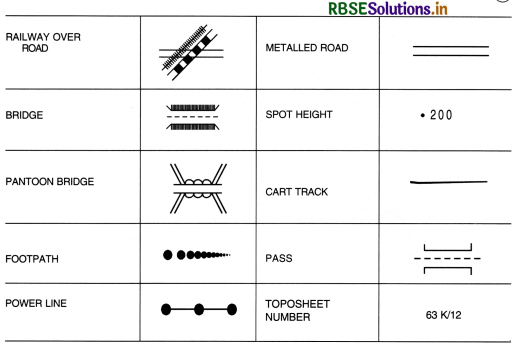
Describe the different conventional signs used on topographic maps.
Answer:
Conventional signs are used to depict the various relief and man-made features on the topographic maps. These form the key of map reading. These are generally shown at the bottom of toposheets. The Survey of India department has prepared a chart showing these signs. This chart is known as Characteristic Sheet. The practice in drawing these signs is necessary for map-reading. The different signs used are grouped under different headings as below :
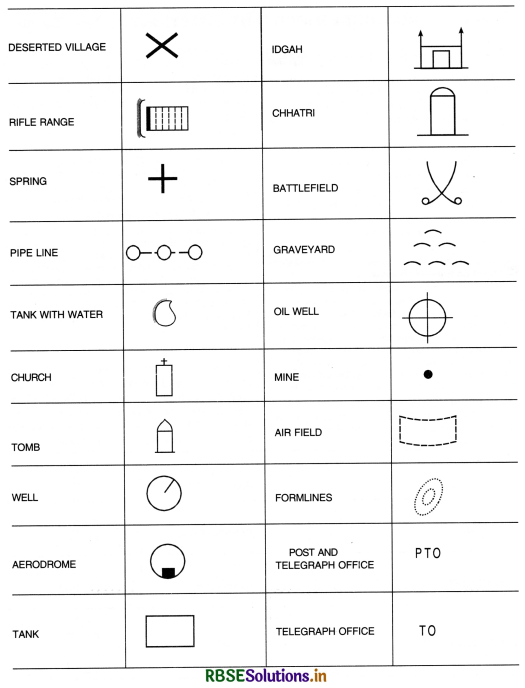
(i) Cultural Features :
- Temple
- Church
- Mosque
- Tomb
- Pagoda
- Idgah
- Chhatri
- Village (Surveyed)
- Demarcated Village
- Deserted Village
- Ruins
- Scattered huts
- Fort (Surveyed)
- Battlefield
- Graveyard
- Oil well
- Mine
- Rifle Range
- Aerodrome
- Aerodrome (Surveyed)
- Air Strip (Surveyed)
- Air Strip
- Well
- Spring
- Pipeline.
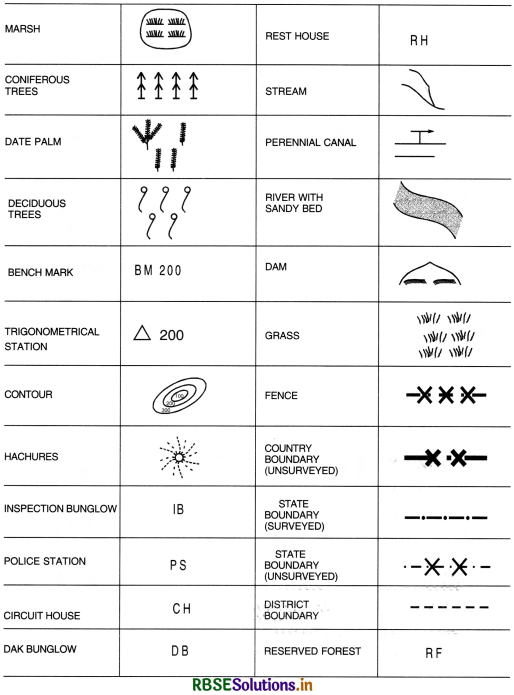
(ii) Physical Features :
- Built Tank
- Marshes
- Perennial River
- Perennial Canal
- Dry River
- Dam
- Orchard
- Vein Trellis
- Grass
- Coniferous trees
- Palm trees
- Garden
- Contours
- Form line
- Trigonometrical Stations
- Bench mark.
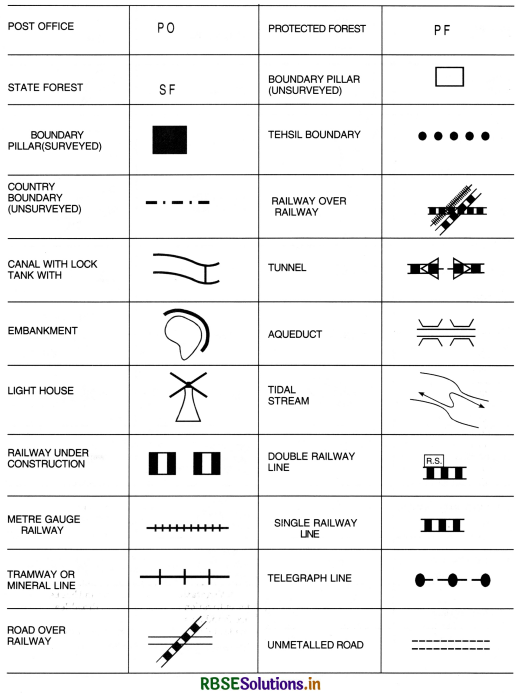
(iii) Building and Boundaries:
- Boundary pillar
- Fence
- Tehsil Boundary
- District Boundary
- State Boundary
- International Boundary (Unsurveyed)
- International Boundary (Surveyed)
- Boundary Pillar (Unsurveyed)
- Rest house
- Police Station
- Post Office
- Telegraph Office
- Circuit House
- Dak Bunglow
- Reserved forests
- State Forests
- Protected forests
- Fort
- Camping Ground
- Lighthouse.
(iv) Means of Transportation :
- Railway line
- Railway line with station
- Metre Gauge (Double)
- Metre Gauge (Single)
- Power line
- Telephone line
- Metalled Road
- Unmetalled Road
- Track
- Foot Path
- Road Bridge
- Ferry Bridge
- Road over Railway
- Rail over Road
- Bridge
- Tunnel.
1. Marginal Information
The given toposheet shows the following marginal informations :
- Name of the topo sheet: Mirzapur-Varanasi (U.P.)
- Name of the topo sheet: 63 K/12
- Scale : 2 cm : 1 km or R.F. 1 : 50,000
- Latitudinal extent: 25° N to 25°15' N
- Longitudinal extent: 82° 30" E to 82° 45' E
- Area of the sheet: About 700 sq
- Year of publication: 1978
- North: Magnetic North \(\frac{1}{2}^{\circ}\) West of True North.
- V.I. = 10 metres.
- Year of survey = 1970-71
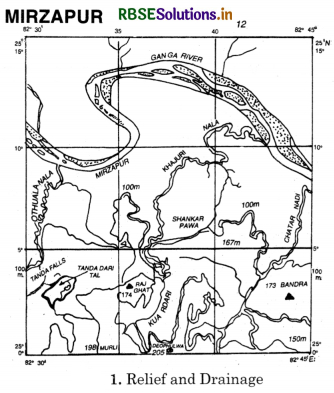
2. Relief. The area can be divided into two main physiographic divisions
- Ganges Plain
- Southern plateau
(a) Ganges Plain :
The Northern part is covered by Ganges plain. It covers 2/3 of the sheet. It is an alluvial plain formed by the deposition of sediments brought by the river Ganges. The average height is 100 metres above mean sea level. The general slope of the area is from West to East as is shown by the direction of the river.
(b) Southern Plateau : This plateau is a part of Vindhyachal ranges. Flat-topped isolated hills are found scattered over the area. It is a well dissected plateau having deep escarpments on its edges. Deophulwa (208 metres) is the highest peak. Other peaks are Murli (198 metres), Rajghat (174 metres), Bandra (173 metres) and Shankar Pawa (167 metres).
3. Drainage. The river Ganga is the master stream flowing from west to east. River forms two big meanders. Mirzapur town is located along one of the meanders. Many tributaries, from the south join the main stream. These include Harai Nadi, Kaveri Nadi and Chattar Nadi. These form narrow deep valleys. These are seasonal rivers. Some waterfalls are also found such as Tanda Falls (33 metres) on Harai Nadi. In the west, Tanda Dari Tal is an important tank.
4. Vegetation. Most of the lowland has been cleared for cultivation and settlements. Broad leaved forests are found on southern plateau. Trees are found along roads and rivers. Some reserved forests are found such as Barkacha, Dante, Bahuti and Bhirpuri.
5. Means of Transportation.
There is scarcity of Roads and Railways due to hilly relief to :
(i) The Ganges River is a navigable waterway.
(ii) Railways: Northern Railway runs from West to East from Prayagraj to Mughal Sarai. There are four railway stations on this broad gauge railway line. A narrow gauge railway line runs in the northern part.
(iii) Roads : Metalled roads are found in plain area to Mirzapur in the centre of roads. The Great Deccan Road (National Highway No. 7) runs from Varanasi to Kanniyakumari. Jaunpur-Mirzapur, Roberts Ganj- Mirzapur roads are found over the plateau.
6. Settlements: Most of the population is rural and agriculture is the main occupation of the people. Linear Settlements are found along roads and railways. Sparse population is found on the Southern Plateau. Mirzapur is the biggest urban centre of the area. It is located on the southern bank of the Ganges. Mirzapur is a focus of Roads and Railways. It is a commercial town where cotton textiles, brass utensils, carpets, woollen textiles are found. Vindhyachal, Kachwa, Khamaria are other towns.
Question 3.
Interpret the physical and cultural features shown on the Indian Toposheet No.
\(45 \frac{J}{8}\)
Answer:
Study of toposheet No. \(45 \frac{J}{8}\)
(1) Name of the Toposheet: Ajmer (Pali and Udaipur districts)
(ii) Number of Toposheet : \(45 \frac{J}{8}\)
(iii) Scale : 1”: 2 miles
(iv) Latitudinal extent: 26°N latitude -to 26° 15’ N
(v) Longitudinal extent: 74° 15’ East to 74° 30’ East
(vi) Area : about 300 sq miles
(vii) Year of Publication: Year 1953
(viii) North: Magnetic North was \(\frac{1}{4}\) °W from True North.
(x) VI. : 50 feet
(x) Year of Survey: 1929-30
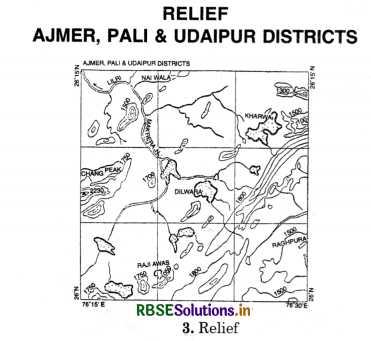
2. Relief. According to relief, the area can be divided into two parts-plain and hilly region.
(a) Plain Area : Most of the plain area extends around the town of Beawar, located in the middle of the sheet. It covers about l/10th of the whole area shown on sheet. Plain area has an extent of about 30 sq miles. The average height of the plains is 1400 feet. The general slope of the land is from S.E. towards N.W. which is shown by the direction of the rivers and the value of contours. This plain extends towards villages of Kharwa, Lambava and Gola in the north.
(b) Hilly Areas : Most of the area covered by toposheet is hilly. Aravalli hills surround these areas and are spread over the parts in the N.W., East and S.E. The average height is more than 1800 ft. The highest peak is Chang peak (2230 ft.) which is situated in the west. It is a residual hill which is flat-topped and not a conical one. It extends like a ridge. Other peaks include Raghupura (1833 ft.) and Rajianiwas (2150 ft.).
3. Drainage. The main rivers of the area are Makrera and Lilri which flow from S.E. to N.W. direction. The Makrera river rises in the North-East from Kana Khera and Khet Khera hills in Aravalli ranges. Water is supplied to the town of Beawar by building a big dam over Makrera river. There are many seasonal rivers in this area which get dry in dry season. Many streams from Dilwara and Samel regions join the main stream. There are many small and large tanks such as
- Makrera Tank
- Kharwa Tank
- Dilwara Tank-There are many permanent wells in plains but these are absent in hilly areas.
4. Vegetation. Many types of trees are found on hill slopes. These include Khajoor, Palm, Bamboo etc. Reserved forests are found around small settlements such as
- Chang R.F.
- Shivpura (iii) Rajpura R.F.
- Kahdaula R.F.
- Rampura R.F.
- Madhopur R.F.
5. Human Settlements. It is a region of sparse population and scattered settlements. This is an agricultural area which has many small rural settlements. Beawar is the largest settlement and a commercial town. It is situated in the middle of an agricultural area.
The old Beawar town is situated at a distance of 2 miles from the Makrera in the North-West. Other settlements include Lambana, Kharwa, Makrera, Gola and Dilwara. The hilly area has very small settlements. These meet their basic needs from the hills. Main occupations are agriculture, lumbering and pastoral farming.
6. Means of Transport: Beawar town is located on the main branch of Western Railway. This railway line connects Beawar with Ajmer and Marwar. It has become a commercial town due to this railway line.
There are four other railway stations on this line. There is absence of metalled roads in this region. The main roads are
- Beawar-Ajmer Road
- Beawar-Khewra Road
- Beawar-Jawaza Road
- Beawar-Masooda Road.
All these roads focus on Beawar. There is absence of roads in N.W. and S.W. due to hills. Small settlements are connected with rural centres by unmetalled roads, cart tracks, and footpaths.
Essay Type Questions
Question 1.
Describe the different methods of showing relief.
Answer:
The following methods are generally used for showing relief:
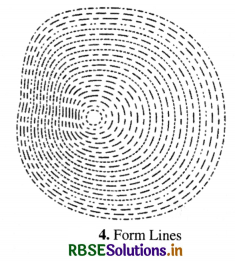
- Form lines
- Hachures
- Hill shading
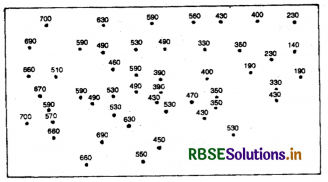
- Spot height
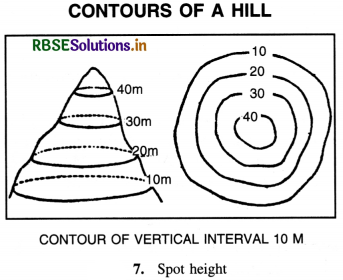
- Contours.
(1) Form lines. In a complicated hilly area, sometime, accurate survey is not possible. In such cases, contours are drawn in by eye. These are approximate contour lines. These broken lines show a general form of the land. The actual heights or value of contours is not given. If these lines are close, they show a steep slope. In case of gentle slope, the lines are wide apart. These are used to show minor details.
(2) Hachures. Hachures are short disconnected lines drawn down the slopes in the direction of maximum slope. These are thick and close, when the slope is steep. These are thin and apart when the slope is gentle. Flat ground is left unshaded. This method was used by Major Lehman
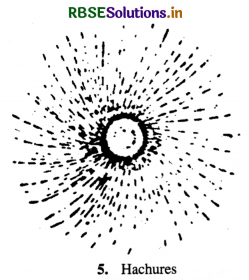
Hachures are drawn at right angles to the directions of contours at any point. These give an idea about the difference in slope of the ground. These convey a general idea of steepness. Dark and crowded hachures represent steep escarpments. But these do not indicate actual heights. These obscure other details. This method is used when contour interval is large and minor details are not shown by contours.
(3) Hill shading. In this method, the slopes are shown by depth of shading. The flat areas appear
light, the slopes are shown dark. In this method, it is imagined that light is thrown vertically over the area and the relief features are shaded accordingly. This method gives an idea of general relief of the area. This is used on small scale maps. It does not convey exact heights. It is an expensive method.
(4) Spot Heights. Spot heights are dots on the map and show the exact height of a point above sea level. These points are plotted after actual survey of the area. These provide definite information about height. These are interpolated to form contours. On topo sheets, spot heights are shown at important places like peaks, passes, roads, railways,etc.
(5) Contours. Contour is the commonest, the most accurate and the most used method of showing relief. A contour is an imaginary line drawn on a map to join all the places of same height above meansea level. This height is shown by a figure written on the contour line. When the contours are close together, these show a steep- slope. But when the contours are wide apart, these show a gentle slope. The difference in the height between one contour and the next is called vertical interval (V.I.). The horizontal distance between two successive contours is called the horizontal equivalent (H.E.).
Merits and Demerits
- It is a standard method of showing relief.
- It is a mathematical method and gives exact height of places.
- Contours can be easily drawn.
- These do not obscure other details.
- These lines are generally drawn in brown colour.
- Contours form the basis of other methods.
- It is used for comparison of slopes.
- It is a slow and costly method.
Sections and Profiles:
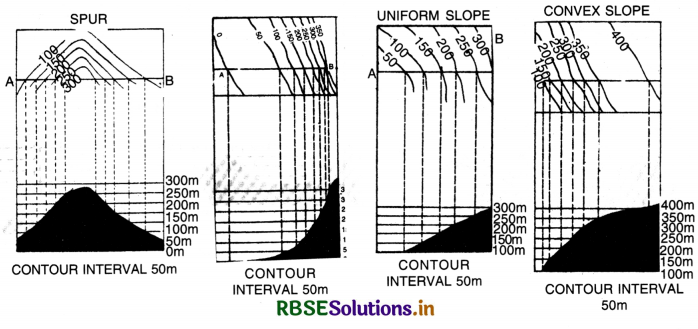
A section is the outline of intersection of ground by a vertical plane. A profile is the definite outline of relief along a line obtained after a section of contoured map. A line is drawn to intersect the contours. Perpendiculars are drawn below, from these intersections, to get a profile. Sections and profiles of different landforms have been drawn ahead:
(1) Uniform Slope. In this slope, the ground has the same slope throughout. This slope is shown by evenly spaced contours.
(2) Convex Slope. It has a gentle slope at the top, but a steep slope at the foot (Bottom)-Therefore, in this, the higher contours are wide apart, while the lower contours are close together.
(3) Concave Slope. It has a steep slope at the top, but a gentle slope at the bottom. The higher contours are drawn close together, while the lower contours are wide apart.
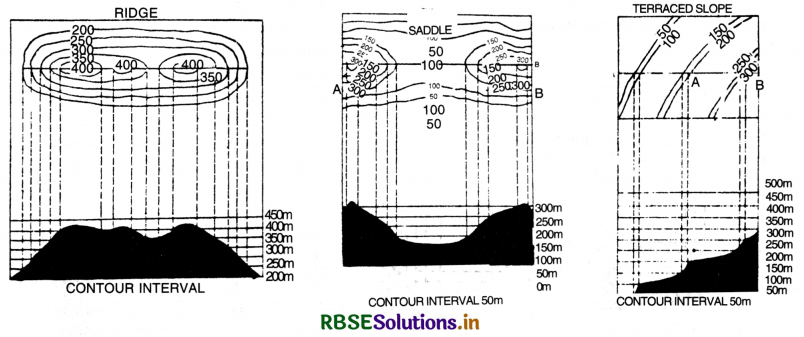
(4) Terraced Slope. This slope runs in the form of terraces. The contours run in pairs. Two successive contours are drawn close to show a steep side while the next two contours are drawn wide apart to show a gentle slope.
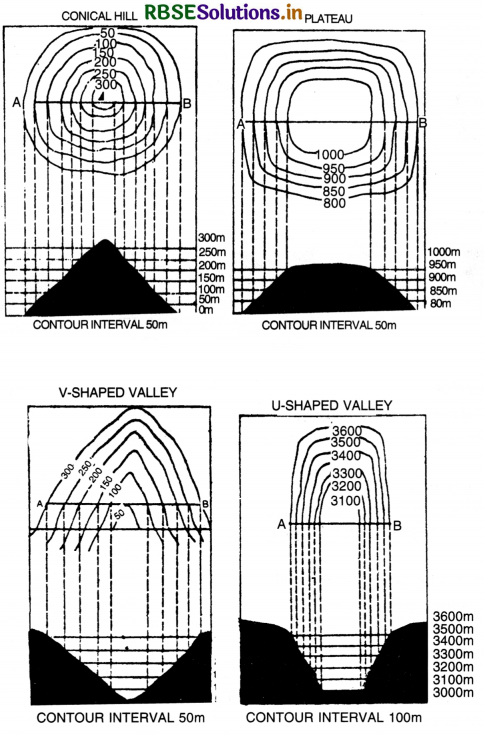
(5) Conical hill. It rises uniformally from the surrounding land and has uniform slope on all sides. The contours are circular with uniform spacing.
(6) Plateau. A broad flat-topped high land rising steeply from the adjoining plain is called a plateau. Contours closely spaced on margins show steep slope : in the central part, there are no contours.
(7) Ridge. It is a high elongated hill. A chain of hills form a long narrow ridge. Contours are generally elongated curves.
(8) Saddle. A saddle is the land or pass connecting two hills. Closed contours show the summits, while there is no contour in the centre.
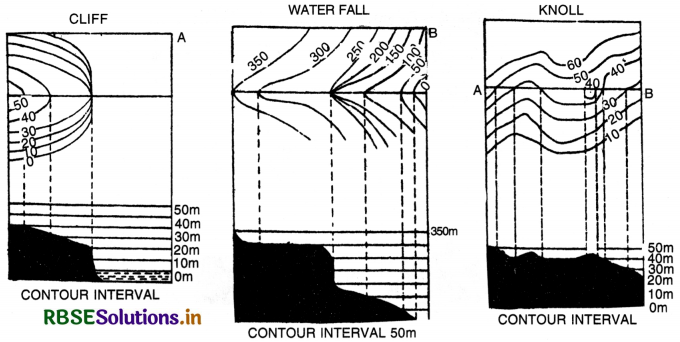
(9) Knoll. Knoll is a low detached hill. Small closed contours show a knoll.
(10) V-Shaped Valley. A long narrow depression with a downward slope is known as a V-shaped valley when a river flows through it. Its contours are ‘V-shaped. The apex of the ‘V points to the higher ground while in the centre contours show lower ground.
(11) U-Shaped Valley. When a glacier moves through a ‘V-shaped valley, it becomes a ‘U’ shaped valley. The contours are closely spaced at margins and show steeps slope.
(12) Spur. A piece of land projecting from higher ground into lower ground is called a spur. Its contours are ‘V’ shaped. The apex of ‘V’ shows lower ground.
(13) Cliff. A steep slope overlooking a sea or lake or a plain is called a cliff. Contours run very close to one another and merge into one.
QUESTIONS FOR VIVA-VOCE
Question 1.
On which scale is topographical maps drawn?
Answer:
Large scale.
Question 2.
Which department prepares the topo-sheets in India?
Answer:
Survey of India Department.
Question 3.
Name the Headquarters of Survey of India Deptment.
Answer:
Dehradun (Uttarakhand).
Question 4.
Name the Index Numbers of Indian topo-sheets.
Answer:
From 40 to 92.
Question 5.
Why are not conventional signs drawn to scale?
Answer:
Because most of the features become very reduced.
Question 6.
Which colour is used to show settlements?
Answer:
Red colour.
Question 7.
What is the scale of international maps?
Answer:
1:1,000,000 (1 cm : 10 km.).
Question 8.
What is the scale of toposheet No. 63 K/12?
Answer:
The scale of toposheet 63 K/12 is 1: 50,000.
Question 9.
Which colour is used to show seasonal rivers?
Answer:
Black colour.
Question 10.
What is the pattern of settlement along the roads and railways?
Answer:
Linear pattern.
Question 11.
How is the slope of an area determined?
Answer:
By direction of river or log value of contours.
Question 12.
Why is bad land area found on tope¬s' sheets of 63 K/12?
Answer:
Due to floods in rivers.
Question 13.
Name the two main types of methods showing relief.
Answer:
- Pictorial methods
- Mathematical methods.
Question 14.
Give two examples of Pictorial methods.
Answer:
- Hachures
- Layer tints.
Question 15.
Which methods are used to show the local height?
Answer:
Benchmarks, spot heights, Trigonometrical station.
Question 16.
Who was the first cartographer to Invent hachures method?
Answer:
Major Lehman.
Question 17.
What is the principle of Hachures?
Answer:
Dark and thick lines show steep slope, but light and apart lines show gentle slope.
Question 18.
What is the main merit of Hachures?
Answer:
These are useful for showing isolated, small features.
Question 19.
Which colour is used for high mountainous region?
Answer:
Dark brown.
Question 20.
In India, from which place is mean sea level determined?
Answer:
It is measured by average height of Tides at Chennai.
Question 21.
What is the difference between Benchmark and Spot height?
Answer:
Bench mark shows the height of mark on a building, but the spot height shows the actual height of a place on the ground.
Question 22.
What is the principle of contours?
Answer:
When the contours are close, these show a steep slope but when the contours are wide apart, these show a gentle slope.
Question 23.
What is height of Mean Sea level?
Answer:
Zero.
Question 24.
What is the difference between V.I. and H.E.
Answer:
The difference in the height between two

- RBSE Solutions for Class 12 Geography Chapter 11 अंतर्राष्ट्रीय व्यापार
- RBSE Solutions for Class 11 Geography Chapter 1 भारत - स्थिति
- RBSE Solutions for Class 11 Geography Chapter 3 पृथ्वी की आंतरिक संरचना
- RBSE Solutions for Class 8 Our Rajasthan Chapter 5 उद्योग
- RBSE Solutions for Class 11 Geography Chapter 2 संरचना तथा भूआकृति विज्ञान
- RBSE Solutions for Class 11 Geography Chapter 1 भूगोल एक विषय के रूप में
- RBSE Class 11 Geography Important Questions Chapter 7 Natural Hazards and Disasters
- RBSE Class 11 Geography Important Questions in Hindi & English Medium
- RBSE Class 11 Geography Important Questions Chapter 6 Soils
- RBSE Class 11 Geography Important Questions Chapter 5 Natural Vegetation
- RBSE Class 11 Geography Important Questions Chapter 4 Climate