RBSE 11th Geography Practical Book Solutions Chapter 8 Weather Instruments, Maps and Charts
Rajasthan Board RBSE Solutions for Class 11 Geography Practical Book Chapter 8 Weather Instruments, Maps and Charts
Rajasthan Board RBSE Solutions for Class 11 Geography in Hindi Medium & English Medium are part of RBSE Solutions for Class 11. Students can also read RBSE Class 11 Geography Important Questions for exam preparation. Students can also go through RBSE Class 11 Geography Notes to understand and remember the concepts easily.
RBSE 11th Geography Practical Book Solutions Chapter 8 Weather Instruments, Maps and Charts
RBSE Class 11 Geography Weather Instruments, Maps and Charts Textbook Questions and Answers
Multiple Choice Questions
1. Choose the right answer out of the four alternatives given :
(i) Which department prepares the weather map of India for each day?
(a) The World Meteorological Organisation
(b) The Indian Meteorological Department
(c) The Survey of India
(d) None of these
Answer:
(d) The Indian Meteorological Department.

(ii) Which two liquids are used in maximum and minimum thermometers?
(a) Mercury and water
(b) Water and alcohol
(c) Mercury and alcohol
(d) None of these
Answer:
(c) Mercury and alcohol.
(iii) Lines connecting the places of equal pressure are called
(a) Isobars
(b) Isohyets
(c) Isotherms
(d) Isohels
Answer:
(a) Isobars.
(iv) The primary tool for weather forecasting is
(a) Thermometer
(b) Barometer
(c) Maps
(d) Weather charts
Answer:
(d) Weather charts.
(v) If there is more humidity in the air, the difference between the readings of a dry bulb and a wet bulb will be
(a) Less
(b) More
(c) Equal
(d) None of these
Answer:
(a) Less.
(vi) Which meterological symbols are used to mark the following on a weather map?
(a) Rain
(b) Mist
(c) Sunshine
(d) Lightning
(e) Overcast Sky
Answer:

Short Answer Type Questions
2. Answer the following questions in about 30 words :
(i) What are the basic elements of weather? Answer: Temperature, pressure, humidity, rainfall.
(ii) What is a weather chart?
Answer:
Showing weather information.
(iii) Which instruments are normally available in Class-I observatory to measure the weather phenomena?
Answer:
Maximum Minimum Temperature Sensor, Raingauge, Barometre, Wind Vane, Hygro- thermograph.
(iv) What are Isotherms?
Answer:
This joining the places of was temperature reduced to sea level.
3. Answer the following questions in not more than 125 words:
Question 1
Discuss how weather maps and charts are prepared and how they are useful to us.
Answer:
The observations being taken at fixed hours are transmitted by code to the forecasting stations. The central office keeps a record of the observations which from the basis for making the weather maps and charts. Weather maps and carts are useful to us. They provide the primary tools for weather forecasting. They help in locating and identifying different air masses, pressure systems etc. They are useful to pilots and defence personnels like farmers and fishermen.
RBSE Class 11 Geography Weather Instruments, Maps and Charts Important Questions and Answers
Essay Type Questions
Question 1.
Describe the construction, working and use of the following meteorological instruments:
- Maximum and Minimum Thermometer
- Aneroid Barometer
- Wind-Vane
- Wet and Dry Bulb Thermometer
- Rain Gauge.
Answer:
1. Maximum and Minimum Thermometer. This instrument is meant for recording the daily maximum and minimum temperature. As it was invented by J. Six, it is known as Six’s maximum and minimum thermometer.
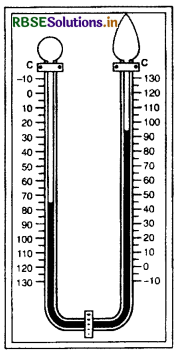
It consists of a U-shaped glass tube, with bulbs at each end. The right hand limb records maximum temperature and its bulb is partially filled with alcohol. The left hand limb records the minimum temperature and its bulb is fully filled with alcohol. The lower parts of the tubes are filled with mercury. Above the mercury, both tubes have steel index needles. These needles are provided with spring arrangements which keep them pressed to the sides of the tube. To set the instrument each index is moved up or down the tube by a small horseshoe-shaped magnet. Mercury can easily move from one side to another. Both the tubes are graduated. In the maximum thermometer, the scale increases upwards while in the minimum thermometer, the scale increases downwards.The readings are taken from the lower ends of the needles
Working and Use. As the temperature rises, the alcohol expands pushing down the mercury towards the maximum side. It pushes the index needle upward. When the temperature falls, alcohol contracts; mercury will move towards minimum side pushing index needle to the minimum temperature. But the index needle of the maximum side remains in its position.
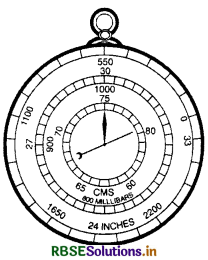
2. Aneroid Barometer. Aneroid Barometer is used for measuring the atmospheric pressure. It gets its name from the Greek word aneros (a = without, neros = liquid) meaning without liquid. It consists of a shallow metallic box. It is partially exhausted of air and sealed to make it air tight. It has a thin flexible lid which is sensitive to pressure changes. A spring is fitted inside the box.
A lever is connected with a needle to indicate the change in pressure on the graduated dial. When the pressure increases, the lid is pushed inwards, and the index needle moves in a clockwise direction. When the pressure decreases, the lid is pushed outward and the index needle moves in an anticlockwise direction. The dial shows the pressure in cms, inches and milibars. It also indicates the change in atmospheric conditions as the words ‘Rain’Clear’, ‘Cloudy’ Dry’ are written on the dial. The instrument is portable and can be easily handled.
It is useful for travellers and mountaineers. A special type of aneroid barometer known as altimeter is used in aeroplanes. As the pressure decreases at the rate of 1 inch for every 900 feet, it can be used for determining the altitude of a place. 3. Wind-Vane. A wind vane or a weather cock is used for measuring wind direction. It consists of an arrow or a weather cock fitted on a vertical rod. The rod forms an axis for the arrow. Vane is a revolving plate balanced on this rod with the help of ball-bearings. Below the arrow, the vertical rod carries a cross indicating four directions-North, South, East and West. This part with the four compass point is stationary.
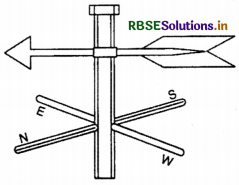
The arrow is free to move with the wind. The pointed end is known as arrow while the broad end is called the tail. The arrow always points towards the direction from which the wind blows. Wind is always named from the direction it blows. As wind direction is blocked, it is erected on tall buildings.
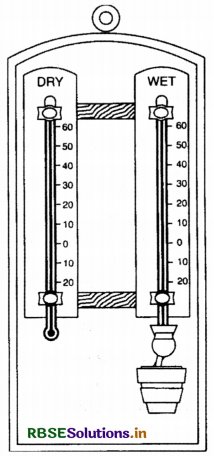
4. Wet and Dry Bulb Thermometer. This instrument is used for measuring relative humidity of the air. It is also known as Mason Hygrometer. Construction and Working. It consists of two thermometers-a dry bulb thermometer and a wet bulb thermometer fixed side by side on a wooden board. One thermometer is uncovered and exposed to the air and is known as Dry Bulb Thermometer. The bulb of the other thermometer is wrapped with a wick of muslin cloth and is dipped into a small vessel of distilled water. It is known as Wet Bulb Thermometer. When the air blows over the instrument, the water from the wet bulb evaporates.
Evaporation leads to cooling of air. It lowers the wet bulb temperature. The temperature in the dry bulb thermometer is not affected by evaporation. The difference of the two thermometer readings determine the relative humidity. It is calculated with the help of prepared tables. The larger the difference, the more arid the air is. If the difference is small, the relative humidity will be more.
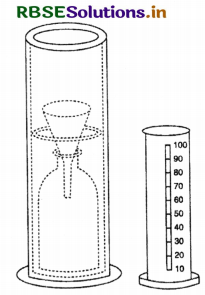
5. Rain Gauge. This instrument is used for measuring the amount of rain in a certain period. It stores rain water without allowing any loss by evaporation run off or seepage.
Construction:
(1) Outer Cylinder. It consists of a copper cylinder 5 inches (12.5 cm) or 8 inches (20 cms) in diameter. It is made of copper because it can resist weathering.
(2) Funnel. The outer cylinder is fitted with a funnel shaped lid of the same diameter so that it fits accurately. The pipe of the funnel leads down to the container (inner cylinder) so that it does not allow any evaporation. A 1/2 inch rim is fitted to the funnel to avoid any splashing out of rain water.
(3) Container. A small glass container or copper cylinder (inner cylinder) or bottle is kept inside to collect the rainwater.
(4) Graduated Glass Cylinder. The water collected is measured by a graduated glass cylinder. It is measured in cms or inches. The reading should be done at eye level to obtain maximum accuracy. The container and the measuring cylinder have a fixed ratio with each other. The water with a height of 1 inch (2.5 cms) in a container shows a height of 10 inch (25.4 cm) in the measuring cylinder. The height of water in measuring cylinder
(h) depends upon diameter
(D) of the container and the diameter
(d) of the measuring cylinder. It is calculated by this
rule h =IMG
Question 2.
What are weather maps?
Answer:
Weather is the study of atmospheric conditions at any place at any specific time. Weather maps show the different elements of weather such as temperature, pressure, winds, cloudiness, and rainfall. These are known as weather charts or synoptic charts. The Indian Meteorological Department publishes Indian daily weather reports from Pune. These maps show weather conditions prevailing at 8.30 a.m. and 5.30 p.m. daily. All India Radio and Doordarshan also broadcast the daily weather Bulletins and weather forecasting.
Question 3.
Explain the importance of weather maps.;
Answer:
Weather maps are of supreme importance in the economic and scientific studies :
- Weather forecasting is done on the basis of the weather maps.
- These maps are useful for farmers, horticulturists, merchants.
- Weather maps are highly useful for air pilots, navigators, fishermen, etc.
- Defence personnel use these maps for their activities.
- Air flights are controlled with the help of weather forecasting.
- Flood control warning is issued to general people with the help of these maps.
- Traders determine the rate of agricultural commodities with the study based on weather maps.
- In India, weather forecasting is done with the help of the Satellite Insat B-I.
Question 4.
Describe the various weather symbols used on weather maps.
Answer:
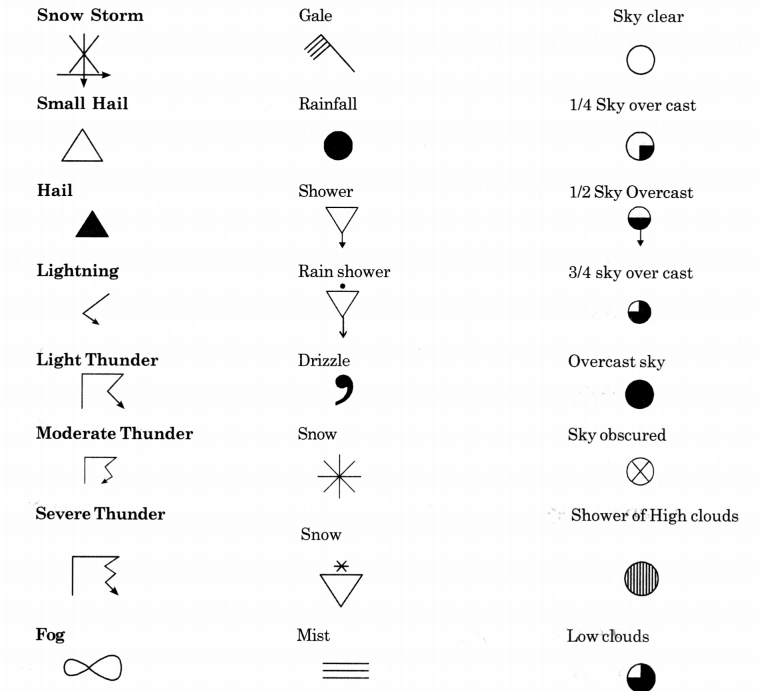
Weather elements are shown on the weather maps with the help of some symbols. These are internationally recognized and are called weather symbols. Different weather phenomena can be identified with the help of these symbols.
- Pressure. Isobars are used to show atmospheric pressure of a place.
- Temperature. Isotherms are used to show temperature of a place.
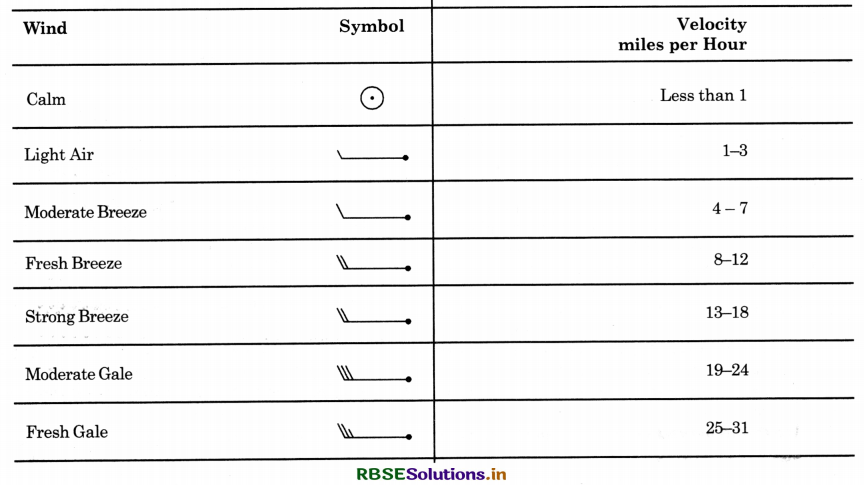
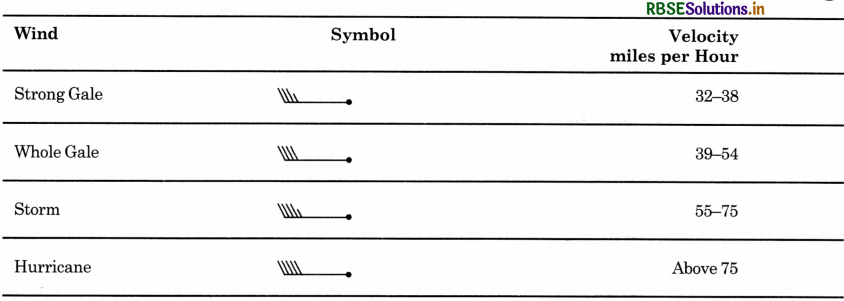
- Winds. Wind velocity and direction is shown by arrows. This system was devised by Admiral Beaufort in 1806 and is known as Beaufort Scale.
4. Clouds. Circles are used to show the nature and amount of cloudiness.
5. Rainfall. Certain symbols and letters are used to show rainfall and other atmospheric phenomena.
Question 5.
Write notes on :
- Isotherms
- Isobars
- Isohyets.
Answer:
- Isotherms. Isotherms are lines joining the places of equal temperature reduced to sea-level.
- Isobars. Isobars are lines joining the places of equal pressure reduced to sea level.
- Isohyets. Isohyets are lines joining the places getting equal amount of rainfall for a certain period.
How to draw these? The values of temperatures of different places are written on the places on the map. The places with equal temperature (say some round number) are joined together to form isotherms. Other isotherms are drawn proportionately to the distance between two isotherms. Similarly isobars and isohyets are drawn.
Question 6.
Describe briefly the Indian daily;
(i) weather report. How is weather forecasting! done on the basis of weather maps?
Answer:
Indian Daily Weather Report Weather is always changing. The study of the different elements of weather is known as Meteorology. This includes the observation, analysis and description of the different elements. For the study of weather, weather maps are prepared. The Indian Meteorological department was established in 1864 at Shimla, but its main headquarter was shifted to Pune in 1914.
This department publishes the daily Indian Weather report. It has pages. On the third and fourth page, daily weather maps are shown. The page 3 shows weather map for 17-30 hrs. I.S.T. and the page 4 shows weather maps for 8.30 hrs. I.S.T. The other pages give different types of information collected by 400 observatories of the country.
Weather Forecasting
The Indian daily weather report describes the weather conditions which prevailed over the country during the last 24 hours. It also forecasts the weather likely to prevail during the next 24 hours. The weather forecasting has an economic and scientific significance. It is useful for farmers, traders and army. The pilots control and divert their flights on the basis of weather forecasting. It is also useful for fishermen, fruit growers, navigators and flood control personnel.
Weather forecast is based on data collected by different observatories. Data is also collected by wireless from ships moving in the Bay of Bengal and Arabian Sea. Data from the clouds in the upper air surface of atmosphere is collected by Photographs obtained from INSAT-B-I. Aerial photograph is a modern source of collecting weather information.
There are more than 300 observatories in the country which provided data to the main headquarters. Weather Bulletins are broadcast from the All India Radio daily. Doordarshan also gives description of Maximum and Minimum temperature of major cities. The cloud cover shown by photographs taken by INSAT-B-I also forms the basis of weather forecasting. This forecast is partly correct. Sometimes, it can be wrong also when the proper precautions are not taken during the observation, and the data is inadequate, the forecast can be false. Due to changing weather conditions weather forecasting may not be dependable sometimes.
Question 7.
Interpret the weather conditions shown on the given Indian daily weather report.
Answer:
Study of Indian daily weather report
1. General information. The given weather map of the Indian sub-continent shows the weather conditions observed on 15th August, 1964 at 8.30 hrs I.S.T.
2. Atmospheric Pressure
(i) General. In general, the atmospheric pressure decreases from South to North ranging between isobars of 994 mb to 1012 mb.
(ii) Location of Bar High. An area of high pressure was observed in the extreme South over Indian Ocean. An isobar of 1012 mb demarcates it. It is a seasonal high. In summer season, high pressure is found over Indian Ocean.
(iii) Location of Bar Low
(a) An area of low pressure is observed over N.W. Pakistan. An isobar of 996 mb demarcates it. It is a seasonal low which is found over land mass in summer.
(b) The second area of low pressure is found in Assam in N.E. India. An isobar of 1004 mb demarcates it. It is due to a cyclonic low.
(c) The third low pressure is found along Odisha coast in the Bay of Bengal. An isobar of 996 mb demarcates it. This is due to tropical cyclones originating from Bay of Bengal.
(iv) Trend of isobars. In this season, isobars run from west to east. But this general trend is disturbed by local disturbances and cyclones. On the Indian Peninsula, isobars make a wedge running from west to east and become circular over Bay of Bengal. Over N.W. India, isobars run from S.W. to N.W. directions.
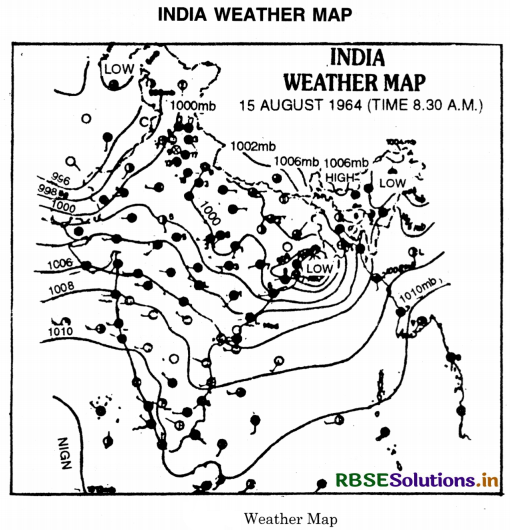
(v) Pressure gradient. Pressure gradient depends upon spacing of isobars. If the isobars are close, it shows a steep gradient. If the isobars are apart, it shows a gentle gradient. Steep gradient is observed over Bay of Bengal while gentle gradient is observed over the rest of the country.
3. Winds.
(i)General. In general, sea to land winds are prevailing over the subcontinent.
(ii) Direction of winds. Winds blow from high pressure to low pressure areas. In summer season, monsoon winds flow from south-west to north-east direction. According to these winds, the direction of winds from west coast to east coast is west-east. As the cyclone is moving up the Ganges valley, the winds blow from east to west.
(iii) Winds velocity. Wind velocity depends upon pressure gradient. When the gradient is steep, the wind has high velocity. But light winds blow due to gentle gradient. The wind velocity is higher in southern India due to steep gradient. On the east coast, a wind velocity of 15-20 kilometres per hour is recorded. In the southern India, winds have a velocity of 10-15 kilometres per hour. Over the rest of the country the wind velocity is 1-10 kilometres per hour.
4. Sky Conditions.
(a) Cloud Cover. Most of the area is covered with clouds due to rainy season. Gujarat, Maharashtra, Madhya Pradesh, Odisha, Ganges plain and hilly areas are overcast with clouds. But Karnataka, and Tamil Nadu are cloudless.
(b) Nature of clouds. Most of the areas have low clouds. Over east coast, high clouds are found.
(c) Other atmospheric phenomena. Over some places, storm and Gale have been observed.
5. Precipitation. It is rainy season and all parts of the country get some amount of rainfall. Punjab, Himachal Pradesh and Uttar Pradesh are areas of high rainfall where a rainfall of 17 mm has been recorded during the last 24 hours. Due to a cyclone, 8 mm. rainfall has been recorded at some places along Odisha coast. Madhya Pradesh, Bihar and Meghalaya has recorded 3 to 6 mm rainfall. Southern Plateau and Rajasthan are dry areas.
6. Sea conditions. Sea waves are moderate over east-coast due to strong winds. Smooth waves prevail over the west coast due to light winds.
QUESTIONS FOR VIVA-VOCE
Question 1.
Name the two elements of climate.
Answer:
Temperature and Rainfall.
Question 2.
What is the difference between climate and weather of a place?
Answer:
Climate is the average of atmospheric conditions for a long time, but weather is a study of atmospheric conditions for a brief period.
Question 3.
What do you mean by temperature of a place?
Answer:
The temperature of a place is the temperature of air, measured in shade, at a height of one metre above the ground.
Question 4.
Where are weather instruments kept?
Answer:
In Stevenson’s Screen.
Question 5.
For climatic study for how long period the average is taken?
Answer:
For 35 years.
Question 6.
Why is alcohol used?
Answer:
Alcohol expands or contracts at the slightest variation in temperature.
Question 7.
Why is mercury used?
Answer:
Mercury can move easily from one side to another.
Question 8.
What is the relation between temperature and pressure?
Answer:
High Temp.- Low Pressure
Low Temp.- High Pressure.
Question 9.
What is the rate of decrease of pressure with height?
Answer:
34 mb per 300 metres.
Question 10.
Which unit of measurement is used in Relative Humidity?
Answer:
Percentage.
Question 11.
Why has the funnel narrow and long pipe?
Answer:
To check the evaporation of rain water.
Question 12.
What is the relation between height of water in outer cylinder and the height of water in rain
Answer:
Height of water in measuring cylinder
\(=\left(\frac{\text { Diameter of Funnel }}{\text { Diameter of Measuring cylinder }}\right)^2\)
h= \(\left(\frac{\mathrm{D}}{d}\right)^2\) 1:10 Ratio]
Question 13.
Where is the Indian Meteorological Deptt. located?
Answer:
At Pune.
Question 14.
Why is this department established at Pune?
Answer:
This place is close to the coast and the effect of monsoons can be well observed here.
Question 15.
For which time, the Indian daily weather map show the weather?
Answer:
8.30 I.S.T. and 17.30 I.S.T.
Question 16.
Which satellite is used to take photographs regarding the weather?
Answer:
INSAT-B-I.
Question 17.
Which unit is used to measure wind velocity?
Answer:
Knots.
Question 18.
What is the velocity in one knot?
Answer:
1.15 mile per hour.
Question 19.
Which unit is used to measure rainfall?
Answer:
Centimetres.
Question 20.
Which type of pressure is found in the centre of cyclone?
Answer:
Low pressure.
Question 21.
What is weather in an area of col?
Answer:
Calm.
Question 22.
What is shape of isobars in a wedge?
Answer:
V-Shaped.
Question 23.
At which rate, does the temperature decreases with height?
Answer:
1°C per 165 metres
Question 24.
Why is temperature reduced to sea level in isotherms?
Answer:
To remove the effect of altitude.

- RBSE Solutions for Class 12 Geography Chapter 11 अंतर्राष्ट्रीय व्यापार
- RBSE Solutions for Class 11 Geography Chapter 1 भारत - स्थिति
- RBSE Solutions for Class 11 Geography Chapter 3 पृथ्वी की आंतरिक संरचना
- RBSE Solutions for Class 8 Our Rajasthan Chapter 5 उद्योग
- RBSE Solutions for Class 11 Geography Chapter 2 संरचना तथा भूआकृति विज्ञान
- RBSE Solutions for Class 11 Geography Chapter 1 भूगोल एक विषय के रूप में
- RBSE Class 11 Geography Important Questions Chapter 7 Natural Hazards and Disasters
- RBSE Class 11 Geography Important Questions in Hindi & English Medium
- RBSE Class 11 Geography Important Questions Chapter 6 Soils
- RBSE Class 11 Geography Important Questions Chapter 5 Natural Vegetation
- RBSE Class 11 Geography Important Questions Chapter 4 Climate