RBSE Class 9 Maths Important Questions Chapter 14 Statistics
Rajasthan Board RBSE Class 9 Maths Important Questions Chapter 14 Statistics Important Questions and Answers.
Rajasthan Board RBSE Solutions for Class 9 Maths in Hindi Medium & English Medium are part of RBSE Solutions for Class 9. Students can also read RBSE Class 9 Maths Important Questions for exam preparation. Students can also go through RBSE Class 9 Maths Notes to understand and remember the concepts easily. Practicing the class 9 math chapter 13 hindi medium textbook questions will help students analyse their level of preparation.
RBSE Class 9 Maths Chapter 14 Important Questions Statistics
I. Multiple Choice Questions :
Choose the correct answer from the given options.
Question 1.
The class corresponding to the class mark 20 is :
(a) 12.5 - 17.5
(b) 17.5 - 22.5
(c) 18.5 - 21.5
(d) 19.5 - 20.5
Answer:
(b) 17.5 - 22.5

Question 2.
The width of each of 5 continous classes in a frequency distribution is 5 and the lower limit of the lowest class is 10. The upper limit of the highest class is :
(a) 15
(b) 25
(c) 35
(d) 40
Answer:
(c) 35
Question 3.
For drawing a frequency polygon of a continuous frequency distribution, we plot the points whose ordinates are the frequencies of the respective classes and abscissae are respectively :
(a) upper limits of the classes
(b) lower limits of the classes
(c) class marks of the classes
(d) upper limit of preceding classes
Answer:
(c) class marks of the classes
Question 4.
Median of the numbers 4, 4, 5, 7, 6, 7, 7, 3, 12 is :
(a) 4
(b) 5
(c) 6
(d) 7
Answer:
(c) 6
Question 5.
If x̄ is the mean of n observations x1 x2, x3 ............ xn then the value of \(\sum_{i=1}^{n}\)(xi - x̄) is :
(a) - 1
(b) 0
(c) 1
(d) n - 1
Answer:
(b) 0
Question 6.
If the mean of the observations x, x + 3, x + 5, x + 7, x + 10 is 9, then the mean of the last three observations is :
(a) 10\(\frac{1}{3}\)
(b) 10\(\frac{2}{3}\)
(c) 11\(\frac{1}{3}\)
(d) 11\(\frac{2}{3}\)
Answer:
(c) 11\(\frac{1}{3}\)
Question 7.
The mean of 100 observations is 50. If one of the observation which was 50 is replaced by 150, the resulting mean will be :
(a) 50.5
(b) 51
(c) 51.5
(d) 52
Answer:
(b) 51
Question 8.
If each observation of the data is increased by 5, then their mean :
(a) remains the same
(b) becomes 5-times the original mean,
(c) is decreased by 5.
(d) is increased by 5.
Answer:
(d) is increased by 5.
Question 9.
In the class interval 10 - 20, 20 - 30, the number 20 is included in :
(a) 10 - 20
(b) 20 - 30
(c) Both of these intervals
(d) None of these intervals
Answer:
(b) 20 - 30
Question 10.
The class mark of the class 90 - 120 is :
(a) 90
(b) 105
(c) 115
(d) 120
Answer:
(b) 105
Question 11.
The marks obtained by 17 students in a mathematics test (out of 100) are given below :
91, 82, 100, 100, 96, 65, 82, 76, 79, 90, 46, 64, 72, 66, 68, 48, 49.
The range of the data is :
(a) 46
(b) 54
(c) 90
(d) 100
Answer:
(b) 54
Question 12.
Mode of the data :
15, 14, 19, 20, 14, 15, 16, 14, 15, 18, 14, 19, 15, 17, 15 is :
(a) 14
(b) 15
(c) 16
(d) 17
Answer:
(b) 15
Question 13.
The median of the data :
78, 56, 22 34, 45, 54 39, 68, 54, 84 is :
(a) 45
(b) 49.5
(c) 54
(d) 56
Answer:
(c) 54
Question 14.
The mid-value of a class interval is 42 and the class size is 10. The lower and upper limits are :
(a) 37 - 47
(b) 37.5 - 47.5
(c) 36.5 - 47.5
(d) 36.5 - 46.5
Answer:
(a) 37 - 47
Question 15.
The mean of six numbers is 30. If one number is excluded their mean becomes 28. The excluded number is :
(a) 38
(b) 36
(c) 35
(d) 40
Answer:
(d) 40
II. Fill in the Blanks :
Question 1.
The class mark of the class 130-150 is ___________.
Answer:
140
Question 2.
Class mark of a particular class is 6.5 and class size is 3, then class interval is ___________
Answer:
5 - 8
Question 3.
In the class interval 10-20, 20-30, the number 20 is included in ___________ class interval.
Answer:
20 - 30
Question 4.
The class mark is also called the ___________ of the class.
Answer:
mid-value
Question 5.
If the mean of the observations x, x + 3, x + 5, x + 7, x + 10 is 9, the mean of the last three observations is ___________.
Answer:
11\(\frac{1}{3}\)
III. True/False :
State whether the following statements are True or False.
Question 1.
Range of a data can be negative.
Answer:
False
Question 2.
Mid-value of class interval is known as class mark.
Answer:
True
Question 3.
Class size of a distribution is different for different class intervals.
Answer:
False
Question 4.
The bar graph can be drawn horizontally or vartically.
Answer:
True
Question 5.
The mean of a data is always less than its median.
Answer:
False
Question 6.
The mean, median and mode of a data may coincide.
Answer:
True
Question 7.
The mode of 6, 5, 3, 5, 6, 5, 8 is 8 as 8 is the highest value
Answer:
False
IV. Very Short Answer Type Questions :
Question 1.
What is the lower limit of the class 31 - 35?
Answer:
Lower limit = 31.
Question 2.
“Height of 20 students of your class” forms which type of data?
Answer:
Primary data.
Question 3.
Find the range of the data 7, 9, 7, 5, 9, 9, 18, 6, 8 and 9.
Answer:
Here the minimum value of 5 and the maximum value is 18.
∴ Range = 18 - 5 = 13.
Question 4.
Find the class size and class mark of the class-interval 15 - 20.
Answer:
Class size = Upper limit - Lower limit
= 20 - 15
∴ Class size = 5
Class mark = \(\frac{(\text { Upper limit }+\text { Lower limit) }}{2}=\frac{20+15}{2}=\frac{35}{2}\) = 17.5
∴ Class mark = 17.5
Question 5.
In the distribution 0, 3, 2, 5, 8, 10, 13, 5, 6, 6, 14, 0 what is the frequency of the class 0-5?
Answer:
For the given distribution, we make a frequency distribution table :
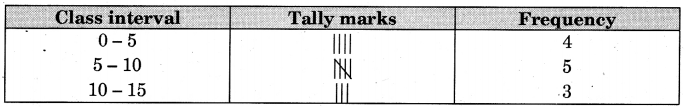
Hence, frequency of the class 0 - 5 is 4.
Question 6.
The class marks of a continuous distribution are 1.04, 1.14, 1.24, 1.34, 1.44, 1.54 and 1.64. Is it correct to say that the last interval will be 1.55 - 1.73? Justify your answer.
Answer:
It is not correct, because the class marks of the continuous frequency distribution are 1.04, 1.14, 1.24, 1.34, 1.44, 1.54 and 1.64 which are at equal gaps, so the classes are of equal size and
Class size = Difference between two consecutive class marks = 1.14 - 1.04 = 0.1
But here class size = 1.73 - 1.55 = 0.18, which is not equal to 0.1.
V. Short Answer Type Questions:
Question 1.
A student got respectively 85, 87 and 83 marks in Maths, Physics and Chemistry. Find his mean marks.
Answer:
The marks are 85, 87 and 83.
∴ Mean = \(\frac{\text { Sum of observations }}{\text { Number of observations }}\)
∴ Mean = \( \frac{85+87+83}{3}=\frac{255}{3}\) = 85
Thus, mean marks are 85.
Question 2.
What is the mean of 1, 2, 3, 4 and 5x?
Answer:
Mean = \(\frac{1+2+3+4+5 x}{5} = \frac{10+5 x}{5}\)
∴ Mean = \(\frac{5(2+x)}{5}\) = (2 + x) or (x + 2)
Hence, mean = (x + 2).
Question 3.
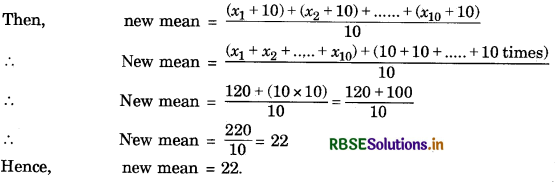
If the mean of 10 observations is 12 and 10 is added to each observation, then find the new mean.
Answer:
We have, mean of 10 observations = 12
i.e., 12 = \(\frac{x_{1}+x_{2}+\ldots . .+x_{10}}{10}\)
⇒ (x1 + x2 + ............... + x10) = 12 × 10
⇒ (x1 + x2 + ............... + x10) = 120 ............ (1)
Now, 10 is added to each observation.
Question 4.
If the mean of 5, 10,15, p, 20, 35, 40 is 21. Then find the value of p.
Answer:
We have X = \(\frac{\text { Sum of observations }}{\text { Number of observations }}\)
⇒ 21 = \(\frac{5+10+15+p+20+35+40}{7}\)
⇒ \(\frac{125+p}{7}\) = 21
⇒ 125 + p = 21 × 7
⇒ 125 + p = 147
⇒ p = 147 - 125
⇒ p = 22
∴ p = 22
Question 5.
In a data of 12 members arranged in ascending order, if the 9th observation is increased by 5, then by how much is the median increased?
Answer:
In 12 observations n = 12 (Even)
∴ Median = \(\frac{6^{\text {th }} \text { observation }+7^{\text {th }} \text { observation }}{2}\)
So, the median remains unchanged, as only the 9th observation is increased by 5.
Question 6.
The mean heights of 8 students is 152 cm. Two more students of height 143 cm and 156 cm join the group. What is the new mean height?
Answer:
Mean height of students = \(\frac{\text { Sum of heights of } 8 \text { students }}{8}\)
152 cm = \(\frac{\text { Sum of heights of } 8 \text { students }}{8}\)
⇒ Sum of heights of 8 students = 152 × 8 = 1216 cm
Now, two more students of heights 143 cm and 156 cm join the group.
∴ Sum of height of 10 students = (1216 + 143 + 156) cm
= 1515 cm
∴ New mean height = \(\frac{\text { Sum of heights of } 8 \text { students }}{10}\)
= \(\frac{1515}{10}\) cm = 151.5 cm
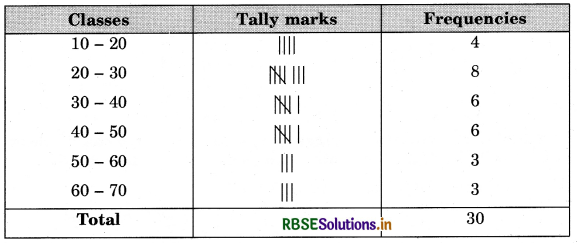
Question 7.
The donations made by 30 houses in a locality are as under:
42, 35, 28,12,14,16, 47, 50, 52, 27, 34, 42, 26, 28, 36,15, 64, 65, 38, 40, 22, 24, 29, 31, 39, 48, 53, 62, 23, 43.
Construct a grouped frequency distribution with class size 10.
Answer:
Here the minimum value of the data = 12, and the maximum value of the data = 65
Let us find the range of the given data.
Range of the data = Maximum value - Minimum value = 65 - 12 = 53.
We need the class size = 10.
We have the classes of the data as :
10 - 20, 20 - 30, 30 - 40, 40 - 50, 50 - 60, 60 - 70
Table
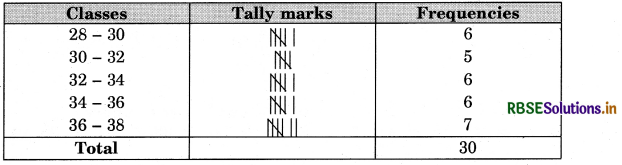
Question 8.
The maximum temperatures (in degrees celcius) for a city in North India for the month of June 2000, as reported by meteorological deparment are as below :
32.4, 30.3, 31.6, 32.5, 33.5, 28.7, 33.4, 35.6, 36.4, 34.7, 35.2, 30.6, 28.5, 29.4, 30.3,
32.5, 34.6, 35.4, 36.1, 37.2, 28.5, 28.1, 29.2, 31.4, 32.5, 36.2, 35.9, 36.7, 37.2, 36.1.
Construct a frequency distribution table with continuous classes each of width 2°C.
Answer:
The minimum value of the data = 28.1°C
The maximum value of the data = 37.2°C
Range of the data = 37.2°C - 28:i°C = 9.1°C
We have the classes as: 28 - 30, 30 - 32, 32 - 34, 34 - 36, 36 - 38 (in degrees celcius).
Table
Question 9.
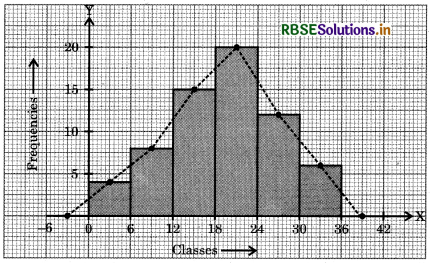
Prepare a frequency polygon with the help of histogram from the following data:

Answer:
We plot the classes (- 6 - 0), (0 - 6), (6 - 12), (12 - 18), (18 - 24), (24 - 30), (30 - 36), (36 - 42) along the X-axis. The frequencies of these classes are respectively 0, 4, 8, 15, 20,12, 6 and 0. These frequencies are plotted along the Y-axis.
After drawing the histogram for the data, we join the mid-points of the top sides of the rectangles of the histogram. The frequency polygon is made with dotted line segments.
Question 10.
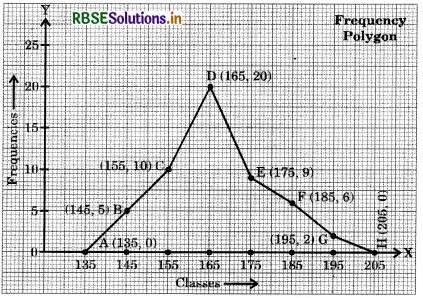
Draw frequency polygon for the data given below, without drawing histogram:

Answer:
We have the classes 130 - 140, 140 - 150, 150 - 160, 160 - 170, 170 - 180, 180 - 190, 190 - 200, 200 - 210 having frequencies 0, 5, 10, 20, 9, 6, 2, 0 respectively.
The class marks of the classes are:
\(\frac{130+140}{2}\) = 135, \(\frac{140+150}{2}\) = 145, ........., \(\frac{200+210}{2}\) = 205 respectively.
We take class marks along X-axis and the frequencies along Y-axis. We plot the points (135, 0), (145, 5), (155, 10), (165, 20), (175, 9), (185, 6), (195, 2) and (205, 0). Now, we join these points and get the required frequency polygon ABCDEFGH as in figure.
Question 11.
Ages (in years) of the members of two sports clubs were recorded and the data collected is as under:
Table
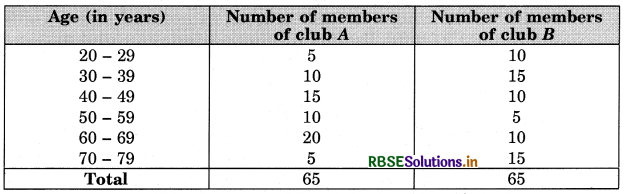
Represent the ages of the members of the sports clubs A and B on the same graph by two frequency polygons. Compare the pattern of the two clubs according to ages of the members.
Answer:
The class marks of the classes 20 - 29, 30 - 39, 40 - 49, 50 - 59, 60 - 69, 70 - 79 are 24.5, 34.5, 44.5, 54.5, 64.5, 74.5 respectively.
The corresponding frequencies for clubs A and B are 5, 10,15, 10, 20, 5 and 10, 15, 10-, 5, 10, 15 respectively.
For the club A, the frequency polygon is drawn by joining the points (14.5, 0), (24.5, 5), (34.5, 10), (44.5, 15), (54.5, 10), (64.5, 20), (74.5, 5), (84.5, 0).
For the club B, the frequency polygon is drawn by joining the points (14.5, 0), (24.5, 10), (34.5, 15), (44.5, 10), (54.5, 5), (64.5, 10), (74.5, 15), (84.5, 0).
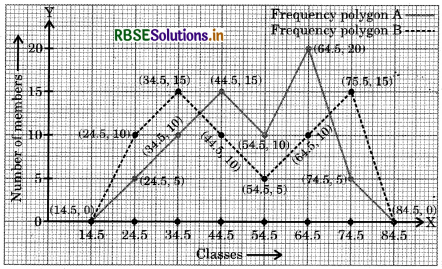
We observe that the club B is more youthful in comparison to club A.
VI. Long Answer Type Questions :
Question 1.
The monthly salaries (in thousand ₹) of 50 workers in a factory are given below:
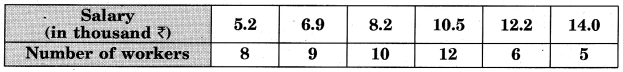
Find the mean salary of a worker.
Answer:
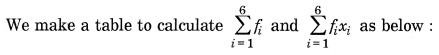
Thus, mean salary of a worker = ₹ 9.098 thousand = ₹ 9098.
Question 2.
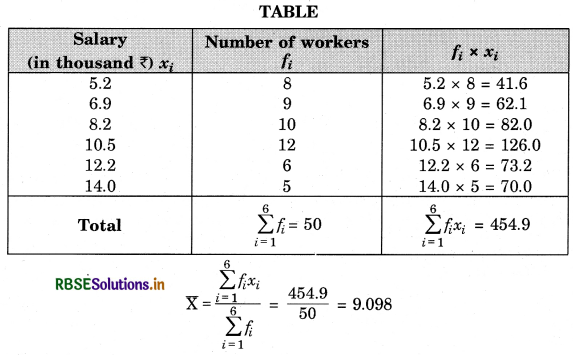
The mean of 30 observations of a data was calculated 24.1. At a later stage, we noticed that a value 18.2 was wrongly read as 12.2. Find the value of the correct mean.
Answer:
Incorrect mean of the 30 values = 24.1
Question 3.
The mean of 12 values of a data is calculated as 19.25. If one more value is included in the data, then for the 13 values of the new data the mean becomes 20. Find the value of this 13th observation (entry).
Answer:
Let x1, x2, ......... , x12 be the 12 values of the data and the 13th value be x13
\(\frac{x_{1}+x_{2}+\ldots \ldots+x_{12}}{12}\) = 19.25
⇒ (x1 + x2 + ............ + x12) = 12 × 19.25 ......... (1)
⇒ (x1 + x2 + ............ + x12) = 231
Also, \(\frac{x_{1}+x_{2}+\ldots \ldots x_{12}+x_{13}}{13}\) = 20
⇒ (x1 + x2 + ............ + x12) + x13 = 13 × 20
⇒ 231 + x13 = 260 (By equation 1)
⇒ x13 = 260 - 231
Hence, x13 = 29
Question 4.
Marks in a mathematics test (out of 10) of a group of 26 students have the following distribution. Find the mean, median and mode of the data.
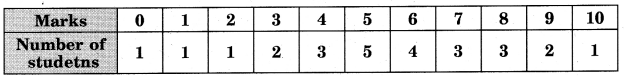
Answer:
Mean: For computing the mean of the given data, we construct the following table:
TABLE
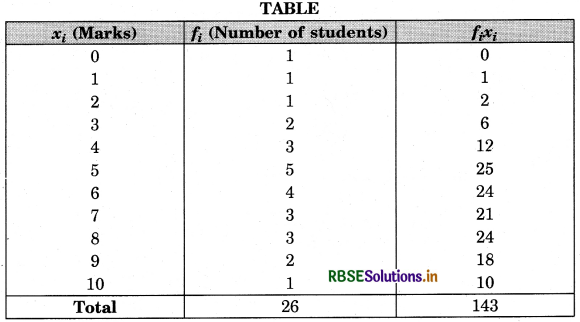
∴ Mean = \(\frac{\Sigma f_{i} x_{i}}{\Sigma f_{i}} = \frac{143}{26}=\frac{11}{2}\) = 55
Median : For computing the median, we arrange the data in ascending order in a line, repeating a score as many times as its frequency.
0, 1, 2, 3, 3, 4, 4, 4, 5, 5, 5, 5, 5, 6, 6, 6, 6, 7, 7, 7, 8, 8, 8, 9, 9, 10.
Since, the number of items is 26, which is an even number, therefore,
median = \(\frac{1}{2}\left\{\left(\frac{26}{2}\right) \text { th item }+\left(\frac{26}{2}+1\right) \text { th item }\right\}\)
= \(\frac{1}{2}\){(13)th item + (14)th item} = \(\frac{1}{2}\)(5 + 6) = \(\frac{11}{2}\) = 5.5.
Mode: Mode is the observation with highest frequency, therefore, mode is 5 as it has maximum frequency.
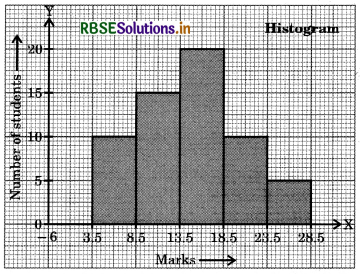
Question 5.
Draw the histogram of the following frequency distribution:

How many students got marks less than 14?
Answer:
The class intervals are 4 - 8, 9 - 13, 14 - 18, 19 - 23, 24 - 28.
We make these classes continuous, by subtracting .5 from the lower limits and adding .5 in the upper limits.
We write the frequency distribution as:

We will plot the marks along the x-axis with scale as, 1 unit = 5 marks
The number of students will be marked on the Y-axis with scale as, 1 unit = 5 students.
Students getting marks less than 14 = 10 + 15 = 25.

- RBSE Solutions for Class 9 Maths Chapter 6 रेखाएँ और कोण Ex 6.3
- RBSE Solutions for Class 9 Maths Chapter 14 सांख्यिकीEx 14.3
- RBSE Solutions for Class 9 Maths Chapter 13 पृष्ठीय क्षेत्रफल एवं आयतन Ex 13.5
- RBSE Solutions for Class 9 Maths Chapter 13 पृष्ठीय क्षेत्रफल एवं आयतन Ex 13.4
- RBSE Solutions for Class 9 Maths Chapter 10 Circles Ex 10.3
- RBSE Solutions for Class 9 Maths Chapter 10 Circles Ex 10.2
- RBSE Solutions for Class 9 Maths Chapter 10 Circles Ex 10.1
- RBSE Solutions for Class 9 Maths Chapter 9 Areas of Parallelograms and Triangles Ex 9.2
- RBSE Solutions for Class 9 Maths Chapter 11 Constructions Ex 11.1
- RBSE Solutions for Class 9 Maths Chapter 9 Areas of Parallelograms and Triangles Ex 9.3
- RBSE Solutions for Class 9 Maths Chapter 11 Constructions Ex 11.2