RBSE Class 6 Maths Important Questions Chapter 9 Data Handling
Rajasthan Board RBSE Class 6 Maths Important Questions Chapter 9 Data Handling Important Questions and Answers.
RBSE Class 6 Maths Chapter 9 Important Questions Data Handling
Multiple Choice Questions
Question 1.
The information collected is called :
(a) tally marks
(b) symbol
(c) bar
(d) data
Answer:
(d) data

Question 2.
A way key using pictures or symbols to represent the data is called :
(a) tally marks
(b) bar graph
(c) pictograph
(d) graph
Answer:
(c) pictograph
Question 3.
Where the number of observations are large, we represent the information using a:
(a) bar
(b) scale
(c) symbol
(d) picture
Answer:
(b) scale
Question 4.
In a bar graph the lengths or the heights of a base represents :
(a) The number of particular item on horizontal line
(b) The number of all items given on horizontal line
(c) The scale used
(d) None of these
Answer:
(b) The number of all items given on horizontal line

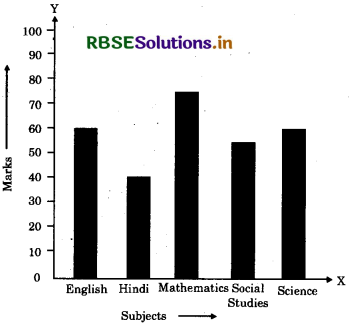
Read the bar graph carefully and answer the following questions (5-8):

Question 5.
The bar graph shows :
(a) marks obtained by a student
(b) alternate in subjects
(c) Both (a) and (b)
(d) None of these
Answer:
(a) marks obtained by a student
Question 6.
The student is poorest in :
(a) English
(b) Science
(c) Mathematics
(d) Hindi
Answer:
(d) Hindi
Question 7.
The student is good in :
(a) Hindi
(b) English
(c) Mathematics
(d) Science
Answer:
(c) Mathematics
Question 8.
The average marks of student is :
(a) 65
(b) 56
(c) 60
(d) 50
Answer:
(b) 56

Fill in the Blanks
Question 1.
A .................... is a collection of numbers gathered to give some meaningful information.
Answer:
data
Question 2.
The data can be arranged in a tabular form using ..........................
Answer:
tally
Question 3.
A .......................... represents data through pictures of objects.
Answer:
pictograph
Question 4.
In a bar graph .......................... can be drawn horizontally or vertically.
Answer:
bars
Question 5.
Number of times an observation occurs is called .......................... of the observation.
Answer:
frequency.
State whether True or False
Question 1.
In a bar graph, the width of the bars may be unequal.
Answer:
False
Question 2.
In a bar graph, bars of uniform width are drawn vertically only.
Answer:
False
Question 3.
In a bar graph, each bar represents (rectangle) only one value of the numerical data.
Answer:
True
Question 4.
In a pictograph, one symbol always depicts one object.
Answer:
False
Question 5.
To represent the population of different towns using bar graph, it is convenient to take one unit length to represent one person.
Answer:
False

Short Answer Type Questions
Question 1.
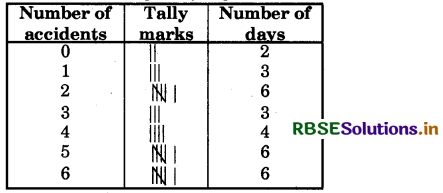
In a study of number of accidents per day, the observation for 30 days were obtained as follows:
6 3 5 6 4 3 2 5 4 2 4 2 1 2 2 0 5 4 6 1 6 0 5 3 6 1 5 5 2 6
Prepare a frequency distribution table.
Answer:
Frequency distribution table of the given number of accidents per day is given below:

Question 2.

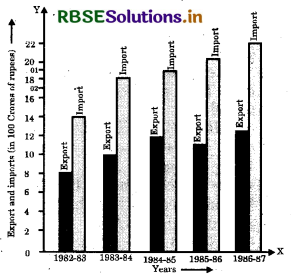
(i) What information is given by the bar graph?
(ii) In which year the export is minimum?
(iii) In which year the import is maximum?
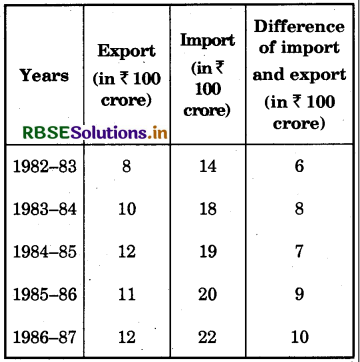
(iv) In which year the difference of the values of export and import is maximum?
Answer:
Let's draw a chart using the information from the above bar graph:

(i) It provides us the information on the total amount of imports and exports in different years between 1982 and 1987.
(ii) In the years 1982-83, the export is at its lowest.
Explanation: In the years 1982-83, exports amounted to ₹? 800 crore, i.e. the lowest from all other years.
(iii) In the years 1986-87, the imports amounted to ₹ 22,000 crore, i.e. the highest from all other years.
(iv) In the years 1986-87, the difference in the amount of exports and imports is the maximum.
Explanation : In the years 1986-87, the difference in the values of export and import is ₹ 1000 crore.
