RBSE Solutions for Class 9 Maths Chapter 14 Statistics Ex 14.2
Rajasthan Board RBSE Solutions for Class 9 Maths Chapter 14 Statistics Ex 14.2 Textbook Exercise Questions and Answers.
Rajasthan Board RBSE Solutions for Class 9 Maths in Hindi Medium & English Medium are part of RBSE Solutions for Class 9. Students can also read RBSE Class 9 Maths Important Questions for exam preparation. Students can also go through RBSE Class 9 Maths Notes to understand and remember the concepts easily. Practicing the class 9 math chapter 13 hindi medium textbook questions will help students analyse their level of preparation.
RBSE Class 9 Maths Solutions Chapter 14 Statistics Exercise 14.2
Question 1.
The blood groups of 30 students of Class VIII are recorded as follows :
A, B, O, O, AB, O, A, O, B, A, O, B, A, O, O,
A, AB, O, A, A, O, O, AB, B, A, O, B, A, B, O.
Represent this data in the form of a frequency distribution table. Which is the most common and which is the rarest blood group among these students?
Answer:
The frequency distribution table is as under:
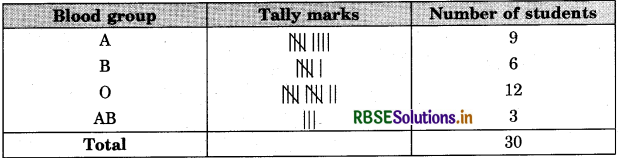
Clearly, most common blood group-0 and rarest blood group-AB.

Question 2.
The distance (in km) of 40 engineers from their residence to their place of work were found as follows:
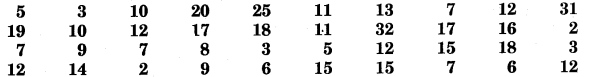
Construct a grouped frequency distribution table with class size 5 for the data given above taking the first interval as 0 - 5 (5 not included). What main features do you observe from this tabular representation?
Answer:
The minimum and maximum km in the given raw data are 2 and 32 respectively. It is given that 0 - 5 is one of the class-intervals and the class size is same. So, the classes of equal size are:
0 - 5, 5 - 10, 10 - 15, 15 - 20, 20 - 25, 25 - 30 and 30 - 35.
Thus, the frequency distribution table is given as under:
In this, the upper limit of a class is not included in the class. Thus, in the class 0 - 5 of km, distance travelled by the engineer to their place of work, an engineer who is to travel .5 km is not included. He is counted in the next class 5 - 10. It is known an exclusive method. It is observed that 27 engineers out of 40 lives at a distance not more than 15 km from their residences.
Question 3.
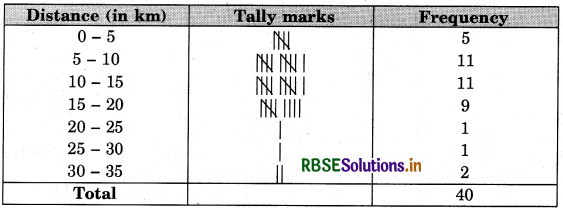
The relative humidity (in %) of a certain city for a month of 30 days was as follows :
(i) Construct a grouped frequency distribution table with classes 84 - 86, 86 - 88, etc.
(ii) Which month or season do you think this data is about?
(iii) What is the range of this data?
Answer:
(i) The minimum and maximum relative humidity (in %) in the given raw data are 84.9 and 99.2 respectively. It is given that 84 - 86 is one of the class- intervals and the class size is same. So, the classes of equal size are :
84 - 86, 86 - 88, 88 - 90, , 98 - 100.
Thus, the frequency distribution table is as under:
|
Relative humidity (in %) |
Frequency |
|
84-86 |
1 |
|
86-88 |
1 |
|
88-90 |
2 |
|
90 - 92 |
2 |
|
92-94 |
7 |
|
94 - 96 |
6 |
|
96 - 98 |
7 |
|
98 - 100 |
4 |
|
Total |
30 |
(ii) The data appears to be taken in the rainy season as the relative humidity is high,
(iii) Range = 99.2 - 84.9 = 14.3.
Question 4.
The heights of 50 students, measured to the nearest centimeters, have been found to be as follows:
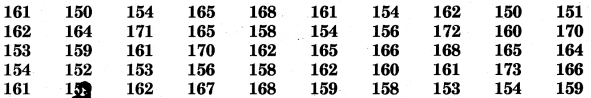
(i) Represent the data given above by a grouped frequency distribution table, taking the class-intervals as 160-165, 165-170, etc.
(ii) What can you conclude about their heights from the table?
Answer:
(i) The minimum and maximum heights in the given raw data are 150 cm and 173 cm respectively. It is given that 160 - 165 is one of the class-intervals and the class size is same. So, the classes of equal size are 150 - 155, 155 - 160, , 170- 175. Thus, the frequency distribution table is as under:
|
Height (in cm) |
Frequency |
|
150 - 155 |
12 |
|
155 - 160 |
9 |
|
160 - 165 |
14 |
|
165 - 170 |
10 |
|
170 - 175 |
5 |
|
Total |
50 |
(ii) One conclusion that we can draw from the above table is that more than 50% of students are shorter than 165 cm.
Question 5.
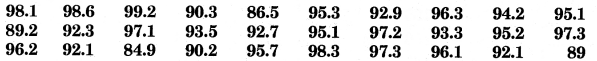
A study was conducted to find out the concentration of sulphur dioxide in the air in parts per million (ppm) of a certain city. The data obtained for 30 days is as follows:
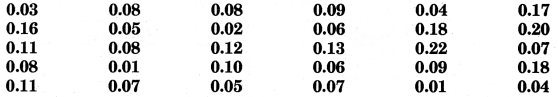
(i) Make a grouped frequency distribution table for this data with class- intervals as 0.00-0.04, 0.04-0.08, and so on.
(ii) For how many days, was the concentration of sulphur dioxide more than 0.11 parts per million?
Answer:
(i) The minimum and maximum of concentration of sulphur dioxide in the air in parts per million is 0.01 and 0.22 respectively. It is given that
0. 00-0.04 is one of the class-intervals and the class size is the same. So, the classes of equal size are :
0. 00-0.04, 0.04-0.08, ............, 0.20-0.24.
Thus, the frequency distribution table is as under:
|
Concentration of sulphur dioxide (in ppm) |
Frequency |
|
0.00 - 0.04 |
4 |
|
0.04 - 0.08 |
9 |
|
0.08-0.12 |
9 |
|
0.12-0.16 |
2 |
|
0.16 - 0.20 |
4 |
|
0.20 - 0.24 |
2 |
|
Total |
30 |
(ii) The concentration of sulphur dioxide was more than 0.11 ppm for 8 days.
Question 6.
Three coins were tossed 30 times simultaneously. Each time the number of heads occurring was noted down as follows :

Prepare a frequency distribution table for the data given above.
Answer:
The frequency distribution table is as under :
|
Number of heads |
Frequency |
|
0 |
6 |
|
1 |
10 |
|
2 |
9 |
|
3 |
5 |
|
Total |
30 |
Question 7.
The value of n upto 50 decimal places is given below:
3.14159265358979323846264338327950288419716939937510
(i) Make a frequency distribution of the digits from 0 to 9 after the decimal point.
(ii) What are the most and the least frequently occurring digits?
Answer:
(i) The frequency distribution table is as under:
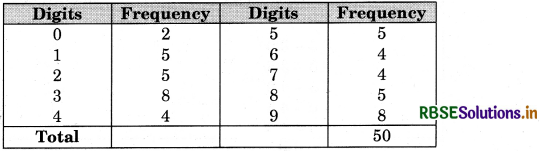
(ii) The most frequently occurring digits are 3 and 9. The least occurring is 0.
Question 8.
Thirty children were asked about the number of hours they watched TV programmes in the previous week. The results were found as follows:

(i) Make a grouped frequency distribution table for this data, taking class width 5 and one of the class-intervals as 5-10.
(ii) How many children watched television for 15 or more hours a week?
Answer:
(i) The minimum and maximum number of hours children watched TV programmes in the previous week are 1 hour and 17 horns respectively. It is given that 5-10 is one of the class-intervals and the class size is same. So, the classes of equal size are 0-5, 5-10, 10-15 and 15-20.
Thus, the frequency distribution table is as under:
|
Number of hours |
Frequency |
|
0-5 |
10 |
|
5-10 |
13 |
|
10-15 |
5 |
|
15-20 |
2 |
|
Total |
30 |
(ii) 2 children, watched television for 15 or more hours a week.
Question 9.
A company manufactures car batteries of a particular type. The lives (in years) of 40 such batteries were recorded as follows :
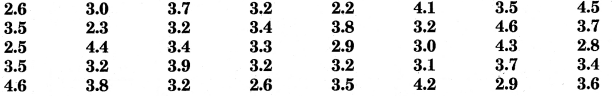
Construct a grouped frequency distribution table for this data, using class- intervals of size 0.5 starting from the interval 2-2.5.
Answer:
The minimum and maximum lives in number of years of car batteries are 2.2 years and 4.6 years. It is given that 2-2.5 is one of the dass-intervals with uniform size of 0.5. So, the classes of equal size are 2.0-2.5, 2.5-3.0, 3.0-3.5, ....,'4.5-5.0.
Thus, the frequency distribution table is as under:
|
Life of batteries (in years) |
Frequency |
|
2.0 - 2.5 |
2 |
|
2.5 - 3.0 |
6 |
|
3.0-3.5 |
14 |
|
3.5 - 4.0 |
11 |
|
4.0-4.5 |
4 |
|
4.5 - 5.0 |
3 |
|
Total |
40 |

- RBSE Solutions for Class 9 Maths Chapter 6 रेखाएँ और कोण Ex 6.3
- RBSE Solutions for Class 9 Maths Chapter 14 सांख्यिकीEx 14.3
- RBSE Solutions for Class 9 Maths Chapter 13 पृष्ठीय क्षेत्रफल एवं आयतन Ex 13.5
- RBSE Solutions for Class 9 Maths Chapter 13 पृष्ठीय क्षेत्रफल एवं आयतन Ex 13.4
- RBSE Solutions for Class 9 Maths Chapter 10 Circles Ex 10.3
- RBSE Solutions for Class 9 Maths Chapter 10 Circles Ex 10.2
- RBSE Solutions for Class 9 Maths Chapter 10 Circles Ex 10.1
- RBSE Solutions for Class 9 Maths Chapter 9 Areas of Parallelograms and Triangles Ex 9.2
- RBSE Solutions for Class 9 Maths Chapter 11 Constructions Ex 11.1
- RBSE Solutions for Class 9 Maths Chapter 9 Areas of Parallelograms and Triangles Ex 9.3
- RBSE Solutions for Class 9 Maths Chapter 11 Constructions Ex 11.2