RBSE Solutions for Class 7 Maths Chapter 3 Data Handling Ex 3.3
Rajasthan Board RBSE Solutions for Class 7 Maths Chapter 3 Data Handling Ex 3.3 Textbook Exercise Questions and Answers.
Rajasthan Board RBSE Solutions for Class 7 Maths in Hindi Medium & English Medium are part of RBSE Solutions for Class 7. Students can also read RBSE Class 7 Maths Important Questions for exam preparation. Students can also go through RBSE Class 7 Maths Notes to understand and remember the concepts easily. Students can access the data handling class 7 extra questions with answers and get deep explanations provided by our experts.
RBSE Class 7 Maths Solutions Chapter 3 Data Handling Ex 3.3
Question 1.
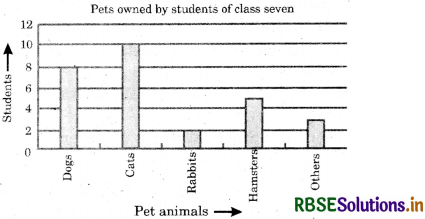
Use the bar graph to answer the following questions :
(a) Which is the most popular pet?
(b) How many children have dog as a pet?
Answer:
(a) ‘Cat’ is the most popular pet.
(b) 8 children have a dog as a pet.
Question 2.
Read the bar graph which shows the number of books sold by a book store during five consecutive years and answer the following questions:
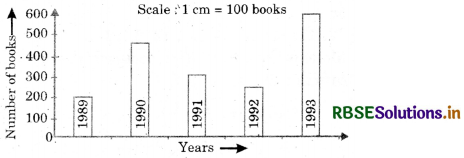
(i) About how many books were sold in 1989, 1990 and 1992?
Answer:
Number of books sold in 1989 = 175 (Approx.)
Number of books sold in 1990 = 475 (Approx.)
Number of books sold in 1992 = 225 (Approx.)
(ii) In which year were about 475 hooks sold? About 225 books sold.
Answer:
Aboout 475 books were sold in 1990, about 225 books were sold in 1992.
(iii) in which years were fewer than 250 books sold?
Answer:
Fewer than 250 books were sold in the years 1989 and 1992.
(iv) Can you explain how you would estimate the number of books sold in 1989?
Answer:
The length of the bar corresponding to 1989 is approx. 1.75 cm.
The scale in 1 cm = 100 books.
∴ Estimated books sold in the year 1989 = 1.75 × 100 = 175 books.
Question 3.
Number of children in six different classes are given below. Represent the data on a bar graph.
|
Class |
Number of Childrens |
|
Fifth |
135 |
|
Sixth |
120 |
|
Seventh |
95 |
|
Eighth |
100 |
|
Ninth |
90 |
|
Tenth |
80 |
(a) How would you choose a scale?
(b) Answer the following questions :
(i) Which class has the maximum number of children? And the minimum?
(ii) Find the ratio of the students of class sixth to the students of class eighth.
Answer:
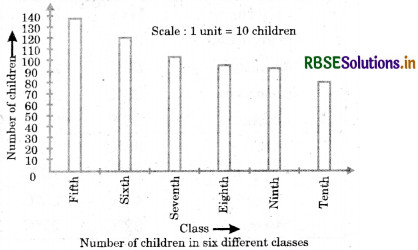
(a) We start the scale at 0.
Since the greatest value in the data is 135, so end the scale at a value greater than 135, such as 140.
Use equal division along the axes, such as increment of 10. Here, we take 1 unit for 10 children.
(b) (i) Fifth class has the maximum number of children, tenth class has the minimum number of children.
(ii) Ratio of the students of class sixth to the students of class eighth
= 120 : 100 = \(\frac{120}{100}\) = \(\frac{6}{5}\) = 6 : 5
Question 4.
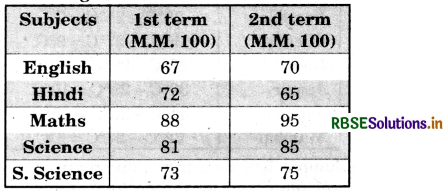
The performance of a student in 1st term and 2nd term is given. Draw a double bar graph choosing appropriate scale and answer the following:
(i) In which subject, has the student improved his performance the most?
(ii) In which subject is the improvement the least?
(iii) Has the performance gone down in any subject?
Answer:
Take a graph paper and draw two lines OX and OY. Mark ‘subjects’ along OX and ‘marks obtained’ along OY. Choose a suitable scale for OY. Here, 1 unit = 10 marks.
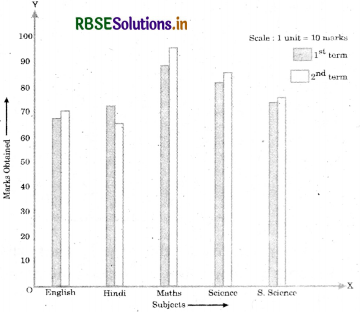
(i) In maths, the student has improved his score by 95 - 88 = 7 marks, which is highest among the given subjects.
(ii) In social science, the student has improved his score by 75 - 73 = 2 marks, which is least.
(iii) Yes, in Hindi, performance of the student has gone down by 72 - 65 = 7 marks.
Question 5.
Consider this data collected from a survey of a colony.
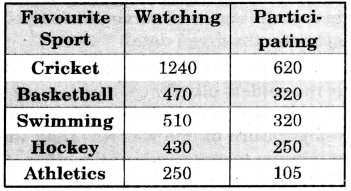
(i) Draw a double bar graph choosing an appropriate scale.
What do you infer from the bar graph?
(ii) Which sport is most popular?
(iii) Which is more preferred, watching or participating in sports?
Answer:
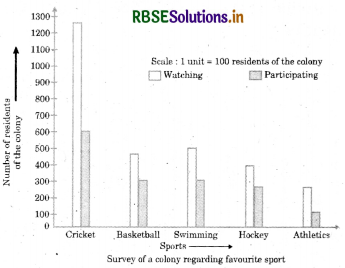
(i) We infer from the graph that the students of colony like cricket the most and athletics the least.
(ii) Cricket is most popular game among students.
(iii) Watching sports is preferred more than participating in sports.
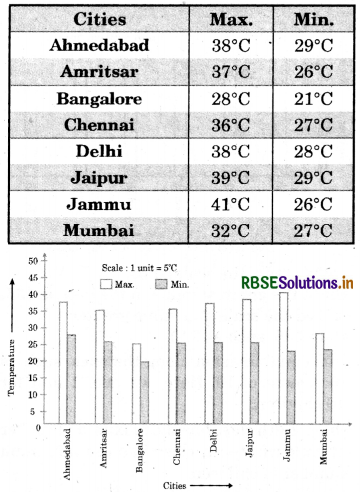
Question 6.
Take the data giving the minimum and maximum temperature of various cities given in the beginning of this chapter (NCERT Text Book Table 3.1). Plot a double bar graph using the data and answer the following :
(i) Which city has the largest difference in the minimum and maximum temper¬ature on the given data?
(ii) Which is the hottest city and which is the coldest city?
(iii) Name two cities where maximum temperature of one was less than the minimum temperature of the other.
(iv) Name the city which has the least difference between its minimum and the maximum temperature.
Answer:
(i)
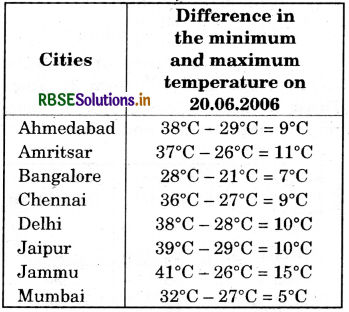
Jammu has the largest difference in the minimum and maximum temperature on the given data.
(ii) Jammu is the hottest city and Bangalore is the coldest city.
(iii) Bangalore and Jaipur, Bangalore and Ahmedabad.
(iv) Mumbai.

- RBSE Solutions for Class 7 Maths Chapter 8 Comparing Quantities Intext Questions
- RBSE Solutions for Class 7 Maths Chapter 6 The Triangles and Its Properties Intext Questions
- RBSE Class 7 Maths Notes in Hindi & English Medium Pdf Download
- RBSE Class 7 Maths Important Questions in Hindi & English Medium
- RBSE Solutions for Class 7 Maths in Hindi Medium & English Medium
- RBSE Solutions for Class 6 Maths Chapter 12 अनुपात और समानुपात Ex 12.2
- RBSE Solutions for Class 6 Maths Chapter 12 अनुपात और समानुपात Intext Questions
- RBSE Solutions for Class 7 Maths Chapter 5 रेखा एवं कोण Intext Questions
- RBSE Solutions for Class 7 Maths Chapter 9 परिमेय संख्याएँ Ex 9.1
- RBSE Solutions for Class 7 Maths Chapter 4 सरल समीकरण Ex 4.3
- RBSE Class 7 Maths Important Questions Chapter 13 घातांक और घात