RBSE Solutions for Class 6 Maths Chapter 9 Data Handling Ex 9.4
Rajasthan Board RBSE Solutions for Class 6 Maths Chapter 9 Data Handling Ex 9.3 Textbook Exercise Questions and Answers.
Rajasthan Board RBSE Solutions for Class 6 Maths in Hindi Medium & English Medium are part of RBSE Solutions for Class 6. Students can also read RBSE Class 6 Maths Important Questions for exam preparation. Students can also go through RBSE Class 6 Maths Notes to understand and remember the concepts easily. Students are advised to practice अनुपात और समानुपात के प्रश्न class 6 of the textbook questions.
RBSE Class 6 Maths Solutions Chapter 9 Data Handling Ex 9.4
Question 1.
A survey of 120 school students was done to find which activity they prefer to do in their free time :
|
Preferred activity |
Number of students |
|
Playing |
45 |
|
Reading story books |
30 |
|
Watching TV |
20 |
|
Listening to music |
10 |
|
Painting |
15 |
Draw a bar graph to illustrate the above data taking scale of 1 unit length = 5 students.
Which activity is preferred by most of the students other than playing?
Answer:
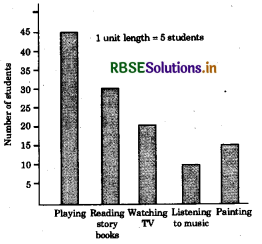
Reading story books is preferred by most of the students other than playing.

Question 2.
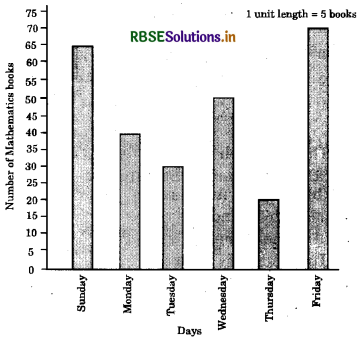
The number of mathematics books sold by a shopkeeper on six consecutive days is shown below:
|
Days |
No. of books sold |
|
Sunday |
65 |
|
Monday |
40 |
|
Tuesday |
30 |
|
Wednesday |
50 . |
|
Thursday |
20 \ |
|
Friday |
70 |
Draw a bar graph to represent the above information choosing the scale of your choice.
Answer:
Question 3.
Following table shows the number of bicycles manufactured in a factory during the years 1998 to 2002. Illustrate this data using a.bar graph. Choose a scale of your choice.
|
Years |
Number of bicycles manufactured |
|
1998 |
800 |
|
1999 |
600 |
|
2000 |
900 |
|
2001 |
1100 |
|
2002 |
1200 |
(a) In which year were the maximum number of bicycles manufactured?
(b) In which year were the minimum number of bicycles manufactured?
Answer:
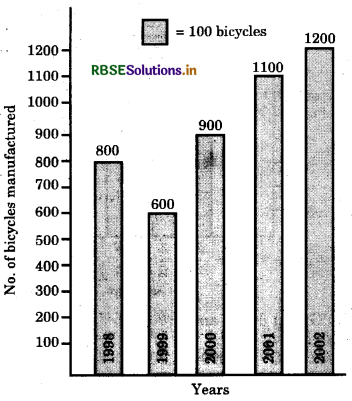
(a) The maximum number of bicycles manufactured in the year 2002.
(b) The minimum number of bicycles manufactured in the year 1999.
Question 4.
Number of persons in various age groups in a town is given in the following table:
|
Age group (in years) |
Number of persons |
|
1-14 |
2 lakh |
|
15-29 |
1 lakh 60 thousand |
|
30-44 |
1 lakh 20 thousand |
|
45-59 |
1 lakh 20 thousand |
|
60-74 |
80 thousand |
|
75 and above |
40 thousand |
Draw a bar graph to represent the above information and answer the following questions (take 1 unit length = 20 thousands):
(a) Which two age groups have same population?
(b) All persons in the age group of 60 and above are called senior citizens. How many senior citizens are there in the town?
Answer:
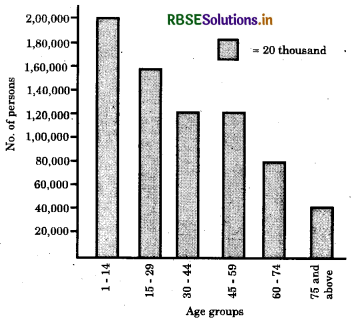
(a) Group 30-44 and group 45-59 have same population,.
(b) 80,000 + 40,000 = 1,20,000 senior citizens are there in the town.

- RBSE Solutions for Class 6 Maths Chapter 2 Whole Numbers InText Questions
- RBSE Class 6 Maths Important Questions Chapter 1 अपनी संख्याओं की जानकारी
- RBSE Solutions for Class 6 Maths Chapter 7 भिन्न Intext Questions
- RBSE Solutions for Class 6 Maths Chapter 7 Fractions Ex 7.4
- RBSE Solutions for Class 6 Maths Chapter 1 Knowing our Numbers Ex 1.1
- RBSE Solutions for Class 6 Maths Chapter 1 Knowing our Numbers InText Questions
- RBSE Solutions for Class 6 Maths in Hindi Medium & English Medium
- RBSE Solutions for Class 6 Maths Chapter 7 Fractions InText Questions
- RBSE Solutions for Class 6 Maths Chapter 7 Fractions Ex 7.6
- RBSE Solutions for Class 6 Maths Chapter 7 Fractions Ex 7.5
- RBSE Solutions for Class 6 Maths Chapter 7 Fractions Ex 7.3