RBSE Solutions for Class 6 Maths Chapter 9 Data Handling Ex 9.3
Rajasthan Board RBSE Solutions for Class 6 Maths Chapter 9 Data Handling Ex 9.3 Textbook Exercise Questions and Answers.
Rajasthan Board RBSE Solutions for Class 6 Maths in Hindi Medium & English Medium are part of RBSE Solutions for Class 6. Students can also read RBSE Class 6 Maths Important Questions for exam preparation. Students can also go through RBSE Class 6 Maths Notes to understand and remember the concepts easily. Students are advised to practice अनुपात और समानुपात के प्रश्न class 6 of the textbook questions.
RBSE Class 6 Maths Solutions Chapter 9 Data Handling Ex 9.3
Question 1.
The bar graph given below shows the amount of wheat purchased by government during the year 1998-2002 Read the bar graph and write down your observations:
(a) In which year was the wheat production maximum?
(b) In which year was the wheat production minimum?
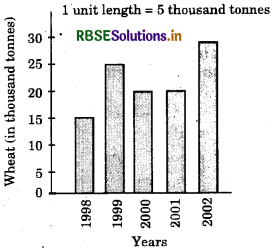
Answer:
(a) In 2002, production of wheat was maximum.
(b) In 1998, production of wheat was minimum.
Question 2.
Observe this bar graph which is showing the sale of shirts in a readymade shop from Monday to Saturday :
Now answer the following questions :
(a) What information does the above bar graph give?
(b) What is the scale chosen on the horizontal line representing number of shirts?
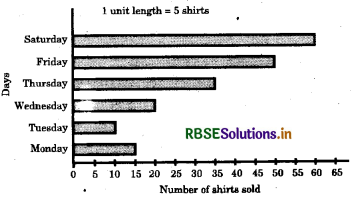
(c) On which day were the maximum number of shirts sold? How many shirts were sold on that day?
(d) On which day were the minimum number of shirts sold?
(e) How many-shirts were sold on Thursday?
Answer:
(a) The bar graph shows the sale of shirts in a readymade shop from Monday to Saturday.
(b) 1 unit = 5 shirts
(c) On Saturday, maximum number of shirts (60 shirts) were sold.
(d) On Tuesday, minimum number of shirts (10 shirts) were sold.
(e) On Thursday, 35 shirts were sold.

Question 3.
Observe this bar graph which shows the marks obtained by Aziz in half yearly examination in different subjects:
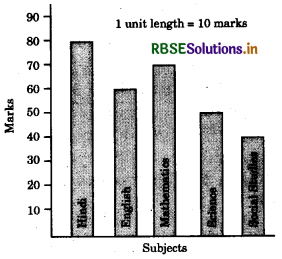
Answer the given questions:
(a) What information does the bar graph give?
(b) Name the subject in which Aziz scored maximum marks.
(c) Name the subject in which he has scored minimum marks.
(d) State the name of the subjects and marks obtained in each of them.
Answer:
(a) The bar graph shows the marks secured by Aziz in half yearly examination in different subjects.
(b) Hindi.
(c) Social Studies.
(d) Hindi 80, English 60, Mathematics 70, Science 50, Social Studies 40.

- RBSE Solutions for Class 6 Maths Chapter 2 Whole Numbers InText Questions
- RBSE Class 6 Maths Important Questions Chapter 1 अपनी संख्याओं की जानकारी
- RBSE Solutions for Class 6 Maths Chapter 7 भिन्न Intext Questions
- RBSE Solutions for Class 6 Maths Chapter 7 Fractions Ex 7.4
- RBSE Solutions for Class 6 Maths Chapter 1 Knowing our Numbers Ex 1.1
- RBSE Solutions for Class 6 Maths Chapter 1 Knowing our Numbers InText Questions
- RBSE Solutions for Class 6 Maths in Hindi Medium & English Medium
- RBSE Solutions for Class 6 Maths Chapter 7 Fractions InText Questions
- RBSE Solutions for Class 6 Maths Chapter 7 Fractions Ex 7.6
- RBSE Solutions for Class 6 Maths Chapter 7 Fractions Ex 7.5
- RBSE Solutions for Class 6 Maths Chapter 7 Fractions Ex 7.3